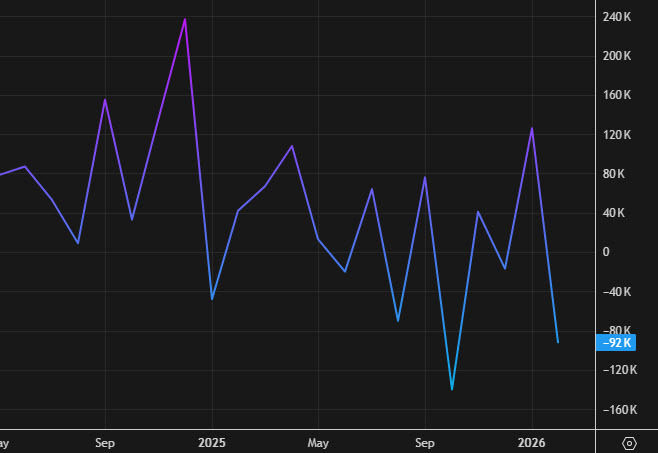
- Prior was +178K (revised to +185K)
- Two-month net revision -16K
- February was -133K (revised to -156K). January was +160K
- Unemployment rate 4.3% vs 4.3% expected
- Prior unemployment rate 4.3%
- Unrounded unemployment 4.337% vs 4.256% prior
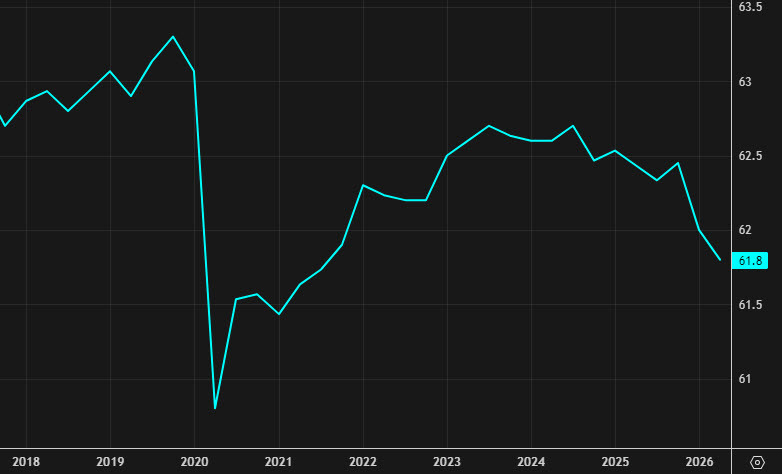
- Participation rate 61.8% vs 61.9% prior
- U6 underemployment rate 8.2% vs 8.0% prior
- Average hourly earnings +0.2% m/m vs +0.3% expected
- Average hourly earnings +3.6% y/y vs +3.8% expected
- Average weekly hours 34.3 vs 34.2 expected
- Change in private payrolls +123K vs +75expected
- Change in manufacturing payrolls -2K vs +5K expected
- Government payrolls -8K vs -5K in March
The U.S. labor market entered May on a strong footing. April nonfarm payrolls rose 115K, while February was revised down by 23K to -156K and March was revised up by 7K to +185K, leaving the two prior months a combined 16K lower than previously reported. The three-month average now sits at 48K.
The composition again flatters the headline. Health care contributed 37K, transportation and warehousing 30K (couriers and messengers alone added 38K), and retail trade 22K, while federal government employment fell another 9K and is now down 348K, or 11.5%, from its October 2024 peak. Information shed 13K and financial activities lost 11K. The unemployment rate held at 4.3%, but participation slipped again to 61.8% from 61.9%, and U-6 underemployment rose to 8.2% from 8.0% as part-time-for-economic-reasons swelled by 445K.
The 6-month hiring average climbed to 55,000 jobs, the most since May 2025.
Wages offered some comfort to the Fed. Average hourly earnings rose 0.2% on the month and 3.6% from a year ago, both lower than expected. With breadth narrowing, federal job losses accelerating, and slack quietly building, April reads less like a soft patch than confirmation that the post-March bounce was the anomaly.