How Day Traders Can Trade AMD After Earnings: A Practical Intraday Map
AMD is still in a high-volatility post-earnings environment, and that creates opportunity, but also danger.
The mistake many day traders make after a major earnings move is assuming that every sharp drop means “the move is over” or every strong bounce means “the breakout is back on.” In reality, post-earnings sessions often rotate between key liquidity zones, VWAP, value area levels, and major round numbers.
For AMD today, the goal is not to predict every candle. The goal is to build a practical map and react when price reaches the important zones.
This article provides an educational intraday framework for AMD day traders. Trade at your own risk.
AMD key levels for day traders today
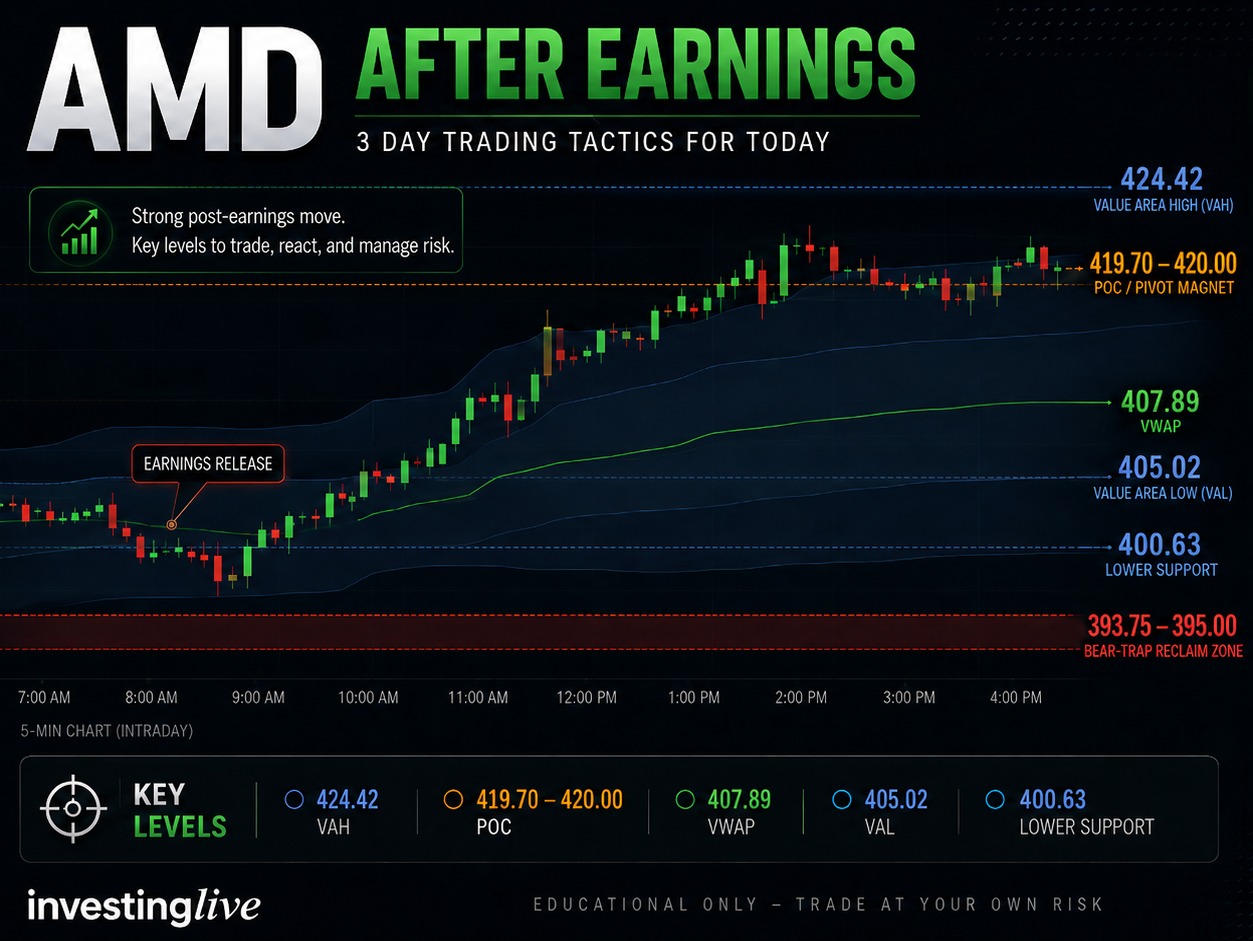
Here are the main levels from the current intraday map:
| Level | Price | Why it matters |
|---|---|---|
| Value Area High | $424.42 | Upper value resistance |
| POC / pivot magnet | $419.70 - $420.00 | Main intraday balance point |
| VWAP | $407.89 | Key mean-reversion reference |
| Value Area Low | $405.02 | Lower value support |
| Lower support | $400.63 | Round-number-adjacent support zone |
| Bear-trap reclaim zone | $393.75 - $395.00 | Second lower VWAP deviation area |
The $419.70 - $420.00 area is the main pivot zone. If AMD holds above it, buyers may still be in control. If AMD loses it, traders should watch for a rotation lower toward VWAP and the lower value area.
But the most interesting opportunity may come much lower, near $395, where a bearish breakdown can potentially become a bear trap.
Why AMD can trap traders after earnings
AMD has already moved sharply after earnings. That means many traders are emotionally anchored to the big move.
Some will chase long too late. Others will short the first strong pullback, expecting a full reversal. Both groups can be vulnerable.
For example, if AMD drops under $400, many traders may assume the stock has suffered a major psychological breakdown. But if price then flushes into the $393.75 - $395.00 zone and quickly reclaims $395, that breakdown may have trapped late bears.
When short sellers cover, they buy back shares. That creates buying pressure. This is why a failed breakdown can become a strong intraday bounce.
Tactic 1: Bear-trap long below $395, then reclaim
This may be the cleanest high-value tactic for aggressive day traders.
Setup
AMD flushes below $395, which is near the second lower VWAP deviation area. This move could attract fresh breakdown shorts and trigger panic from late longs.
Trigger
AMD crosses below $395, then reclaims $395 with a strong 5-minute close back above it.
Possible trade plan
| Item | Level |
|---|---|
| Entry idea | Reclaim of $395 |
| Stop idea | Below the reclaim low or below $393.50 |
| Target 1 | $400 |
| Target 2 | $405.02 |
| Target 3 | $407.89 VWAP |
Why this can work
A drop below $400 can look scary. But if AMD cannot stay below $395, the market may be telling traders that sellers overreached. Shorts who entered the breakdown may then cover, creating a bounce toward the round number at $400, then possibly toward $405 - $408.
This is not a trade to anticipate blindly. The key is the reclaim. Without the reclaim, it is not a bear-trap setup.
Tactic 2: Fade resistance near $422 - $424.42
This tactic is for traders who prefer not to chase AMD after a strong post-earnings rally.
Setup
AMD pushes back toward the upper resistance zone between $422 and $424.42.
This zone includes the upper VWAP deviation area and the Value Area High at $424.42.
Trigger
Price trades into $422 - $424.42, then fails to hold above $422.
Possible trade plan
| Item | Level |
|---|---|
| Entry idea | Rejection below $422 after testing the zone |
| Stop idea | Above $424.60 |
| Target 1 | $420.00 POC |
| Target 2 | $407.89 - $408.00 VWAP area |
Why this can work
After a large earnings move, a push into upper value resistance can attract profit-taking. If AMD cannot accept above $422 - $424.42, the move may rotate back toward the POC near $420, then potentially toward VWAP.
This is a fade, not a guess. Traders should wait for rejection, not short just because price reaches resistance.
Tactic 3: Bounce-watch zone at $405 - $408
This tactic is useful if AMD loses the $420 pivot and starts rotating lower.
Setup
AMD drops below the $419.70 - $420.00 POC and sells toward the lower value and VWAP area.
Bounce-watch zone
$405.02 - $407.89
This area combines the Value Area Low near $405 and VWAP near $407.89.
Bullish trigger
AMD tests $405 - $408, rejects lower prices, then reclaims $408 or forms a clear higher low above $405.
Possible long plan
| Item | Level |
|---|---|
| Entry idea | Reclaim of $408 or higher low above $405 |
| Stop idea | Below $404 or below the rejection low |
| Target 1 | $419.70 - $420.00 POC |
| Target 2 | $422.00, if momentum continues |
Bearish failure scenario
If AMD breaks below $405 and cannot reclaim VWAP near $408, then the bounce setup weakens.
In that case, the next downside zones become:
$400.63
$400 round number
$393.75 - $395.00 bear-trap reclaim zone
The important point: a drop to $405 - $408 is not automatically bearish. It may actually be the first serious area where shorts cover and dip buyers test the stock.
Simple AMD intraday decision map
Here is the simplified trader map:
Above $420:
AMD can still rotate toward $422 - $424.42.
Rejection at $422 - $424.42:
Watch for a fade back toward $420, then possibly $408.
Below $420:
AMD becomes vulnerable to a VWAP / lower value test around $405 - $408.
At $405 - $408:
Watch for a bounce attempt. Do not assume the stock is crashing.
Below $400:
Do not automatically chase short. The better educational setup may be a flush below $395 followed by a reclaim.
Below $395 with no reclaim:
The bear-trap idea is invalid until AMD proves it can recover that zone.
Why VWAP and value area matter for AMD day traders
VWAP is widely watched by intraday traders and algorithms because it reflects the average traded price weighted by volume. When a high-volume stock moves far away from VWAP after earnings, traders often look for either continuation or mean reversion.
The value area gives traders another useful framework. It highlights where a large portion of trading activity has occurred. The POC, or point of control, is the price area with the most accepted volume. That is why $419.70 - $420.00 matters so much for AMD today.
When price moves away from the POC, traders should ask:
Is AMD accepting new prices, or is it stretching too far and likely to rotate back?
That question is more useful than simply asking whether the last candle was green or red.
Final thought for AMD day traders
AMD is still tradable after earnings, but traders should avoid emotional reactions around round numbers like $400.
A clean break below $400 may look bearish, but if AMD flushes into $393.75 - $395.00 and reclaims $395, the market may be trapping late shorts. On the other hand, if AMD cannot reclaim that area, the bearish pressure remains valid.
For today, the most important trading zones are:
$422 - $424.42 for upside rejection,
$419.70 - $420.00 as the pivot magnet,
$405 - $408 as the VWAP / lower value bounce area,
and $393.75 - $395.00 as the potential bear-trap reclaim zone.
This AMD trade map is for educational purposes only. It is not financial advice. Trade at your own risk.


