
FUNDAMENTAL OVERVIEW
The S&P 500 has been printing new record highs every week since the start of April despite the prolonged US-Iran stalemate and the Strait of Hormuz closure. The market can support persistently elevated oil prices as long as the Fed maintains a neutral stance as that keeps easing financial conditions.
The problem is that the Fed is about to abandon the easing bias at the upcoming FOMC meeting and given the persistently elevated inflation and resilient US data, the Fed might even deliver a hawkish surprise which would trigger a bigger and more aggressive pullback. That’s because elevated oil prices coupled with Fed tightening risk would weigh on growth expectations.
If we do get an official resolution, the reopening of the Strait could give the stock market another boost in the short-term as oil prices will likely fall and rate cut bets will increase. With the reopening of the Strait and lower oil prices though, the increase in economic activity could keep inflation higher for longer and eventually require rate hikes anyway, so the data will take centre stage.
S&P 500 TECHNICAL ANALYSIS – DAILY TIMEFRAME
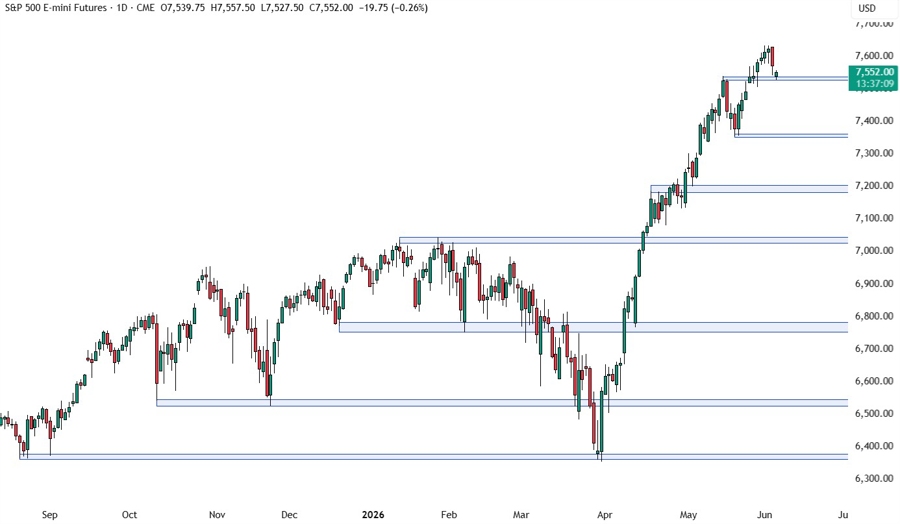
On the daily chart, we can see the S&P 500 pulled back into the 7,530 support zone. This is where the dip-buyers stepped in with a defined risk below the support to position for a rally into new record highs. The sellers will need the price to break below the support to extend the pullback into the 7,360 support next.
S&P 500 TECHNICAL ANALYSIS – 4 HOUR TIMEFRAME
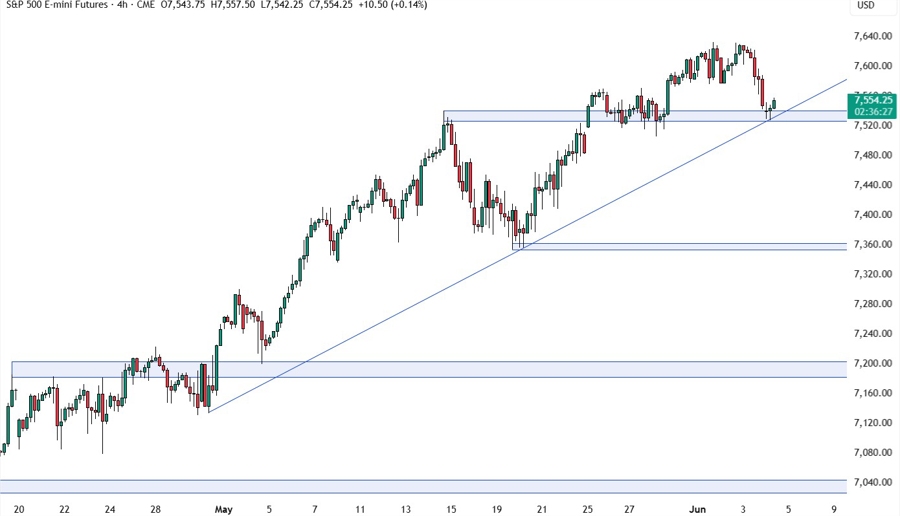
On the 4 hour chart, we have an upward trendline defining the bullish momentum and adding confluence to the support zone. This should technically make the support stronger. The buyers will likely continue to step in around these levels with a defined risk below the trendline to keep pushing into new highs. The sellers, on the other hand, will need the price to break lower to pile in for a drop into the 7,360 level next.
S&P 500 TECHNICAL ANALYSIS – 1 HOUR TIMEFRAME
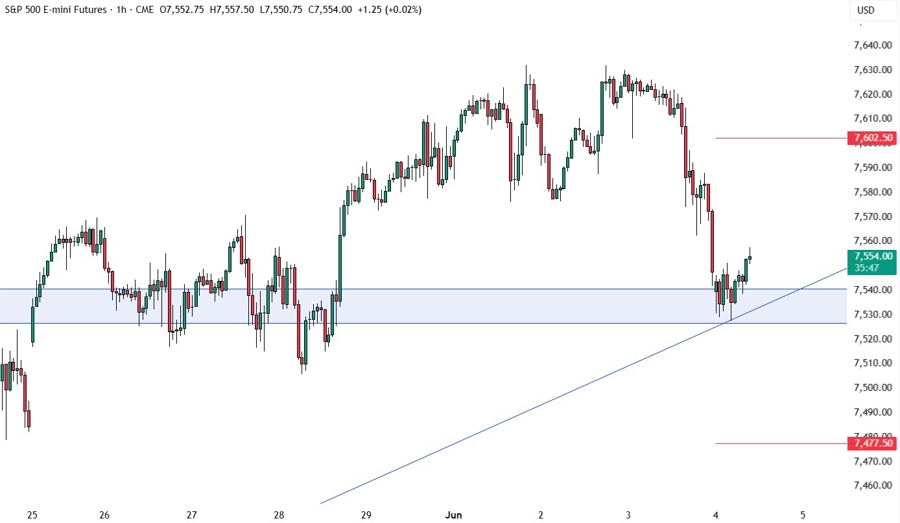
On the 1 hour chart, there’s not much we can add as the buyers will likely continue to pile in here to target new highs, while the sellers will wait for a break to extend the pullback into new lows. The red lines define the average daily range for today.
UPCOMING CATALYSTS
Today, we get the latest US Jobless Claims figures. Tomorrow, we conclude the week with the US NFP report.


