
FUNDAMENTAL OVERVIEW
The S&P 500 extended the gains into new record highs today following several positive news on the US-Iran front. Late yesterday, the US Secretary of State Marco Rubio declared Operation Epic Fury concluded and its objectives achieved. That was followed by Trump tonight pausing Project Freedom so that the US could work to finalise a deal with Iran. The pause was of course interpreted as another step towards a deal.
Lastly, earlier in the session, we got an Axios report saying that US and Iran are getting close to a one-page memo to end the war and that US officials are said to be expecting Iran's response to several key points in the next 48 hours.
The constant push for a diplomatic resolution instead of another full-fledged war has been supporting the risk sentiment on expectations that a deal would be reached eventually. The major risk now is the stretched positioning. If things go south on the US-Iran front or the Fed suddenly turns hawkish and opens the door for rate hikes, we could see a quick unwinding and significant losses.
Bear in mind that the Fed is slowly abandoning the easing bias amid resilient US data and elevated energy prices. The reopening of the Strait would keep supporting the upside in stocks as oil prices would likely crater and rate cut bets would increase on lower inflation worries and less hawkish Fed.
After that though, the focus will quickly turn back to the Fed and the economic data. With the end of the war, the increase in economic activity could keep inflation higher for longer and eventually even require rate hikes to bring it sustainably back to the 2% target that the Fed has been missing since 2021.
S&P 500 TECHNICAL ANALYSIS – DAILY TIMEFRAME
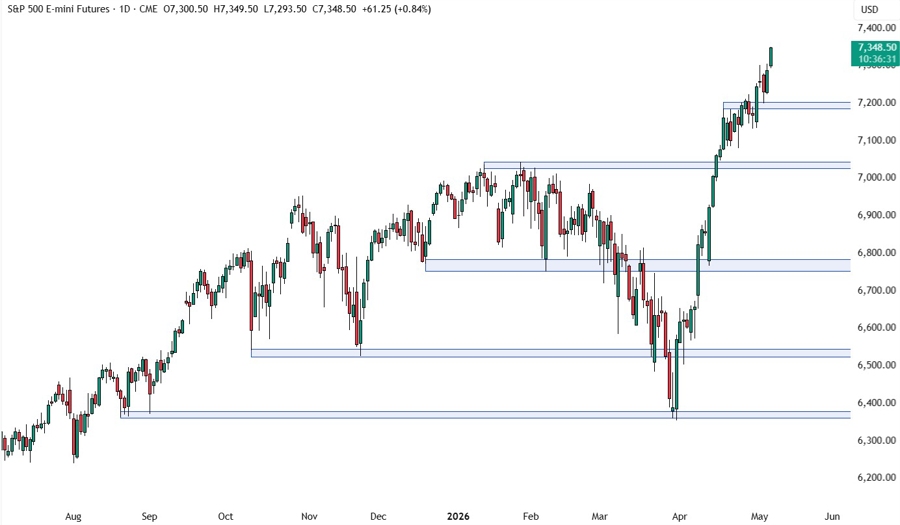
On the daily chart, we can see the S&P 500 extended the gains into yet another all-time high today. From a risk management perspective, the buyers will have a better risk to reward setup around the 7,200 support zone to keep pushing into new highs. The sellers, on the other hand, will need the price to break below the support to open the door for a bigger pullback into the 7,050 level next.
S&P 500 TECHNICAL ANALYSIS – 4 HOUR TIMEFRAME
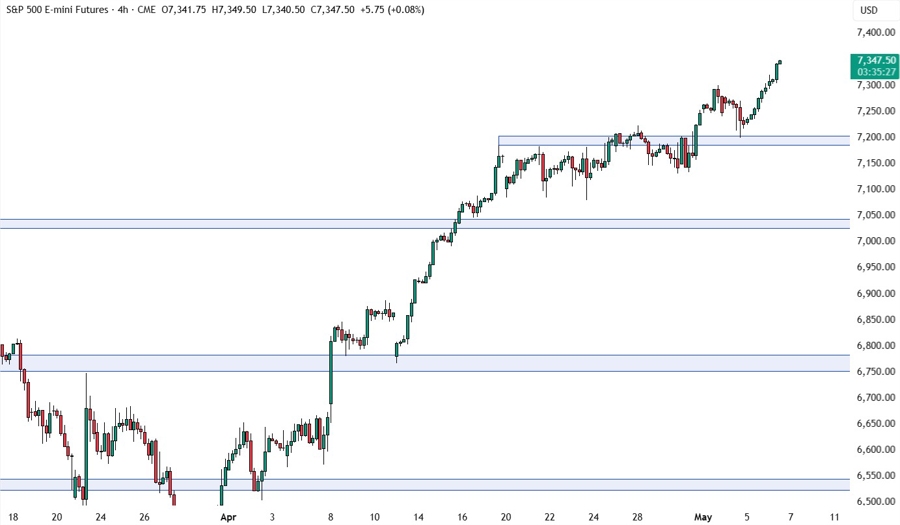
On the 4 hour chart, there’s not much we can add here as the support zone around the 7,200 level remains the only significant technical level where the buyers would have a better risk to reward setup to keep targeting new highs and for the sellers, a break below it would open the door for lower lows.
S&P 500 TECHNICAL ANALYSIS – 1 HOUR TIMEFRAME
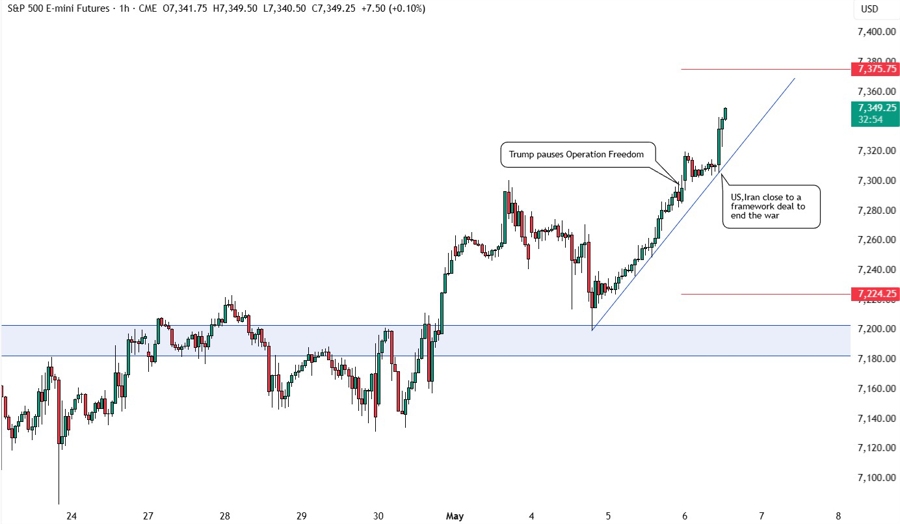
On the 1 hour chart, we can see the latest catalysts that pushed the market into new record highs. The buyers will likely continue to lean on the upward trendline to keep pushing into new highs, while the sellers will look for a break lower to extend the pullback into the 7,200 support next. The red lines define the average daily range for today.
UPCOMING CATALYSTS
Today we have the US ADP report. Tomorrow, we get the latest US Jobless Claims figures. On Friday, we conclude the week with the US NFP report and University of Michigan Consumer Sentiment survey.


