
FUNDAMENTAL OVERVIEW
Gold is again on the backfoot as yet another rally on optimism gets faded. Tonight, Iran's IRGC launched a wave of ballistic missile attacks targeting US military bases across the Gulf, including an Air Base in Kuwait. Iranian officials described the strikes as retaliation for US actions against an oil tanker near the Strait of Hormuz and military operations on Qeshm Island.
Bahrain, Saudi Arabia and the United Arab Emirates also reported attacks at multiple facilities hosting US personnel. According to US Central Command, American forces conducted "self-defense" operations, including strikes on targets on Qeshm Island in response to attempted attacks by Iran.
The ceasefire continues to look weaker by the day but a full resumption of the conflict seems unlikely. The negotiating deadlock has been dragging on for a long time and oil prices are likely to remain persistently elevated until the Strait of Hormuz is reopened.
This keeps increasing the risk of a hawkish Fed. More and more policymakers are now pushing for dropping the easing bias, so we can expect that to happen at the upcoming FOMC meeting. Moreover, if nothing changes on the Strait of Hormuz side before then, we might get a hawkish surprise as inflation continues to run hot and the US data remains resilient.
In the short-term, a resolution and the reopening of the Strait will likely support gold on falling oil prices and increased rate cut bets. But if the Strait remains closed for longer and oil prices stay elevated, the risk of the Fed being forced to hike anyway increases, and that’s going to keep weighing on gold.
GOLD TECHNICAL ANALYSIS – DAILY TIMEFRAME
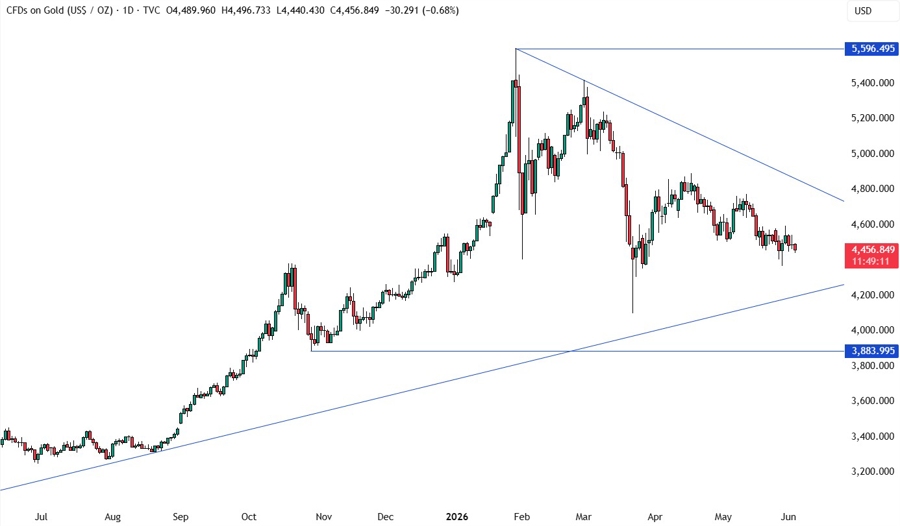
On the daily chart, we can see that gold is again consolidating as traders await new catalysts to push the price into either direction. We are trading right in the middle of the two key trendlines, so there’s not much we can glean from this timeframe. We need to zoom in to see some more details.
GOLD TECHNICAL ANALYSIS – 4 HOUR TIMEFRAME
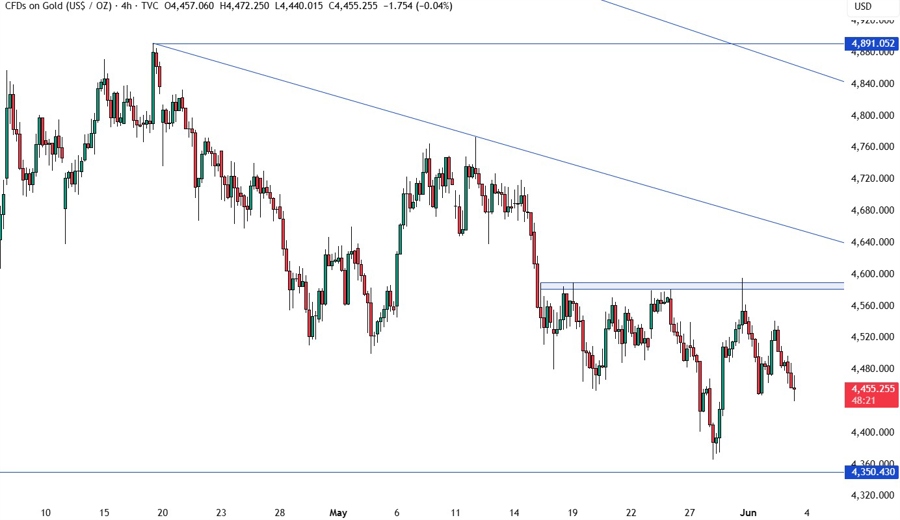
On the 4 hour chart, we have a key resistance zone around the 4,585 level where the price got rejected from several times. From a risk management perspective, the sellers will have a better risk to reward setup around the resistance and the downward trendline to position for a drop into new lows. The buyers, on the other hand, will need the price to break above the trendline to open the door for a rally into the 4,850 level next.
GOLD TECHNICAL ANALYSIS – 1 HOUR TIMEFRAME
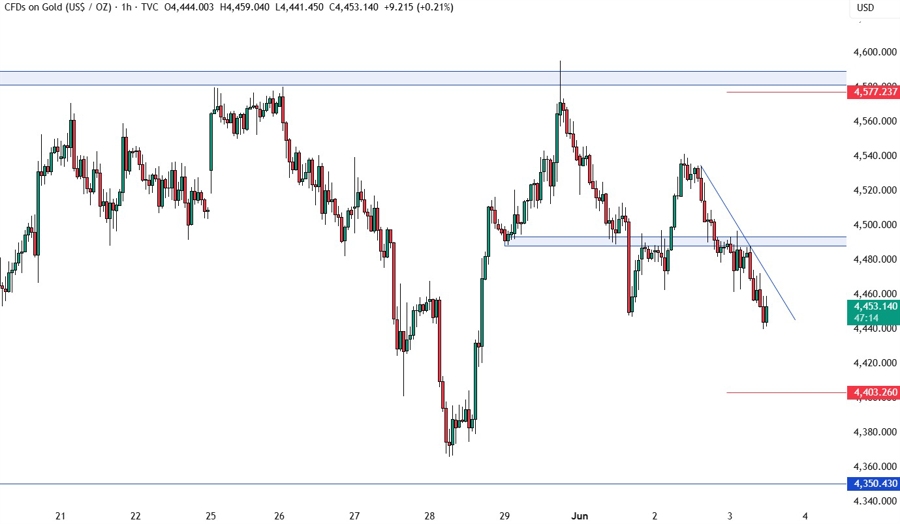
On the 1 hour chart, we have a minor downward trendline defining the current bearish momentum. The sellers will likely continue to lean on the trendline to keep pushing into new lows, while the buyers will look for a break higher to extend the pullback into the 4,490 zone. If the price pulls back into the zone, we can expect the sellers to step in there with a defined risk above it to position for a drop into new lows, while the buyers will look for a break to increase the bullish bets into the 4,585 resistance. The red lines define the average daily range for today.
UPCOMING CATALYSTS
Today, we have the US ADP report and the US ISM Services PMI. Tomorrow, we get the latest US Jobless Claims figures. On Friday, we conclude the week with the US NFP report.


