
FUNDAMENTAL OVERVIEW
USD:
The US dollar surged across the board on the more hawkish than expected dot plot (the consensus was looking for no cuts or hikes this year). The median dot showed one rate hike this year and some of those hawkish members pencilled in multiple hikes. By projecting a rate hike, the Fed effectively adopted a tightening bias in the short-term.
The market increased rate hike bets immediately with now 38 bps of tightening priced in by year-end. There's a 40% chance of a hike already in July and 72% probability of a move in September.
The economic data and financial markets will now guide the Fed as Warsh stated that “financial markets perform best when they react to incoming data and are less efficient when they have to ask how the Federal Reserve will react to the incoming data”. He added that “financial markets are the most important source of information to guide the central bank”.
Trump also posted on Truth Social and, unlike his usual stance under Fed Chair Powell, did not object to the Fed’s decision. In fact, he said that “rate hikes could happen,” which sounds like a green light for Warsh and the Fed to do whatever they deem necessary.
The signal is that the Fed is finally looking to deliver on its price stability mandate and bring inflation back to the 2% target that it’s been missing since 2021. If the data says they need to hike, they will.
My expectation is that the negative supply shock caused by the US-Iran war turns into a positive demand shock now that the war ended and oil prices dropped significantly. I think that's going to boost economic activity further and the markets are already positioning for that scenario.
JPY:
On the JPY side, the BoJ hiked the policy rate to 1.00% as widely expected and announced the pause to the bond tapering programme from next fiscal year.
The forward guidance remained the same with the BoJ looking to continue the normalisation process, raising the policy interest rate and adjust the degree of monetary accommodation “in response to developments in economic activity and prices as well as financial conditions”.
BoJ’s Uchida didn’t offer anything new in the press conference reiterating the central bank’s willingness to raise rates further if economic conditions align. The Japanese CPI data today came in line with expectations with all the inflation metrics below the 2% target. The divergence with the Fed will continue to keep the USD/JPY pair skewed to the upside.
USDJPY TECHNICAL ANALYSIS – DAILY TIMEFRAME
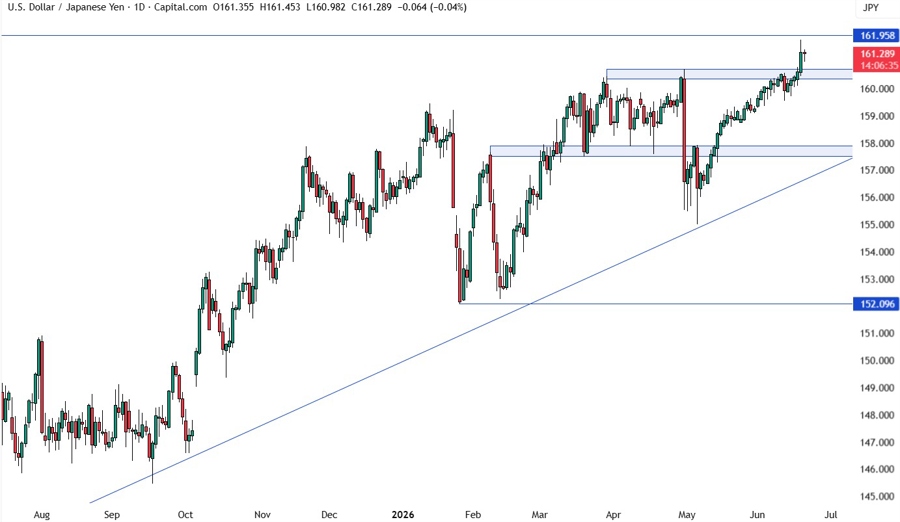
On the daily chart, we can see that USDJPY broke out of the consolidation around the 160.00 handle and surged towards the 162.00 handle following the more hawkish than expected Fed’s dot plot. We can expect the sellers to step in around the 162.00 level with a defined risk above it to position for a correction to the major upward trendline. The buyers, on the other hand, will want to see the price breaking higher to increase the bullish bets into new highs.
USDJPY TECHNICAL ANALYSIS – 4 HOUR TIMEFRAME
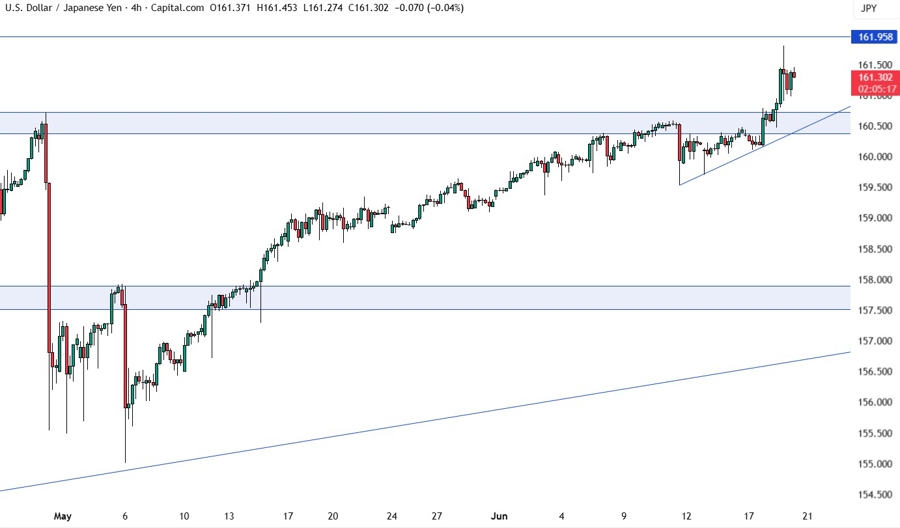
On the 4 hour chart, we have a minor upward trendline and a support zone around the 160.50 level. This is going to be a key spot now. If we get a pullback, we can expect the buyers to step in around the support with a defined risk below it to keep pushing into new highs. The sellers, on the other hand, will look for a break lower to pile in for a drop back into the 158.00 handle next.
USDJPY TECHNICAL ANALYSIS – 1 HOUR TIMEFRAME
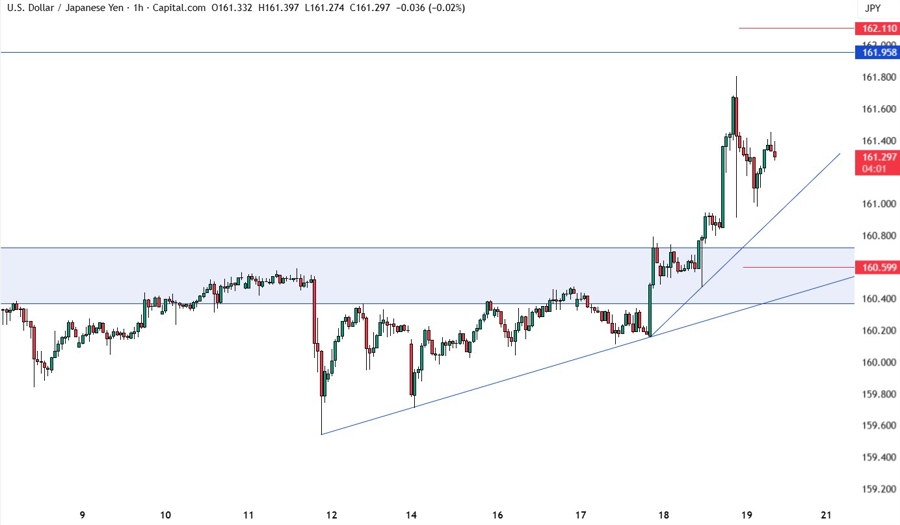
On the 1 hour chart, we have yet another minor upward trendline defining the bullish momentum on this timeframe. We can expect the buyers to lean on the trendline to keep pushing into new highs, while the sellers will look for a break to extend the pullback into the 160.50 support next. The red lines define the average daily range for today.


