
"Houston, we have a problem...", SPCX rally loses upper-value acceptance
SpaceX stock, ticker SPCX, is still far above its IPO price, but the latest chart structure is no longer a clean bullish continuation. My current read is that SPCX has shifted into a post-IPO exhaustion and failed-repair setup, with sellers using the $208-$214 area aggressively and price now testing lower value around $193.50-$196.50.
Key takeaways for SPCX stock holders (and some of you traders)
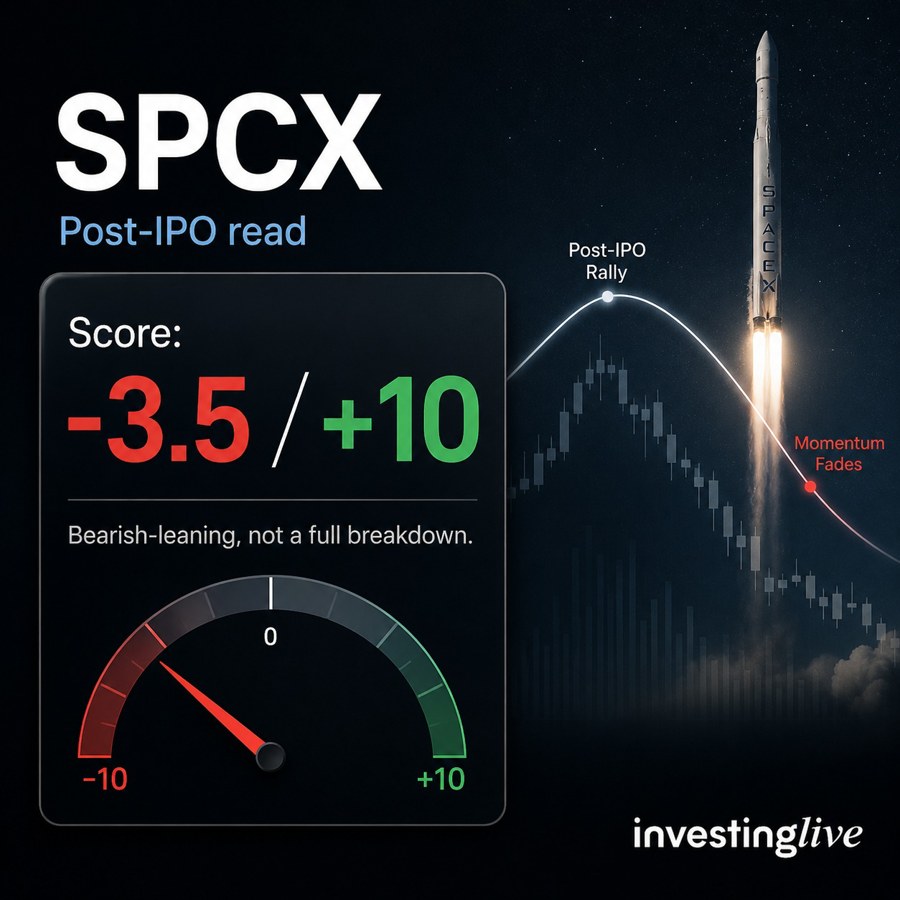
Current bias: Bearish-leaning after failed upper-value acceptance.
Blended tradable score: -3.5 / +10.
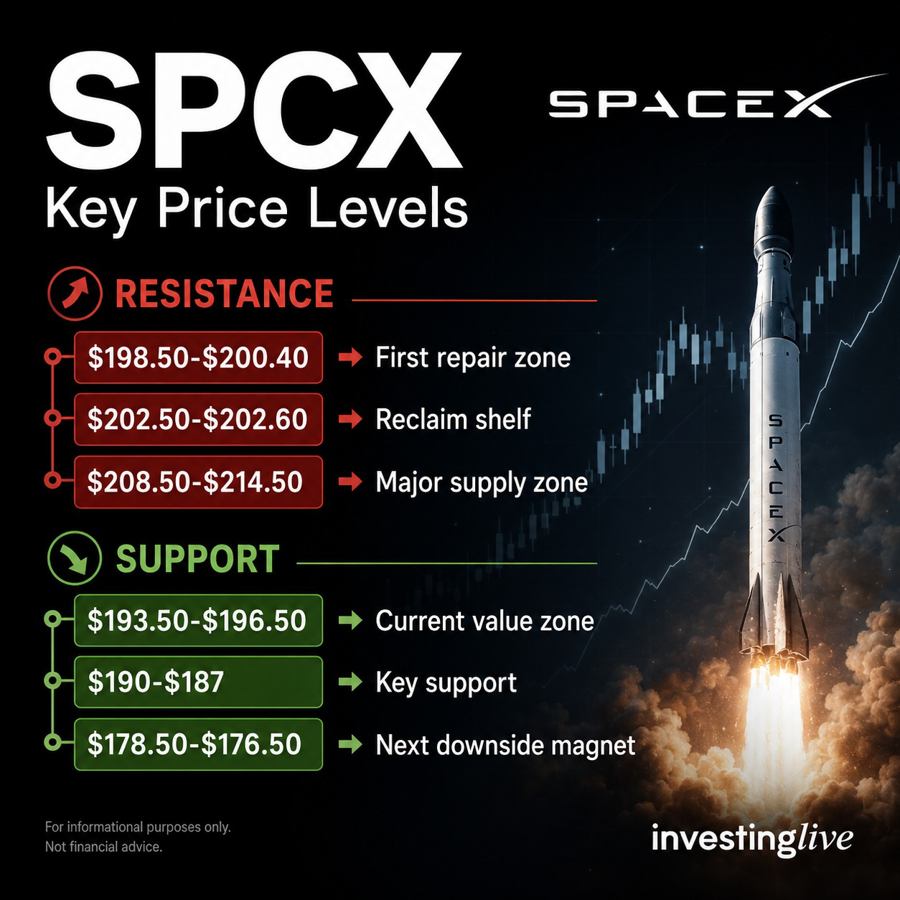
Main resistance zone: $198.50-$202.60, then $208.50-$214.50.
Main support zone: $193.50-$196.50, then $190-$187.
Practical read: I would not chase a short directly into the lows. The cleaner setup is a failed bounce into resistance.
On my -10 to +10 scale, -3.5 means a moderate bearish edge. It is not an extreme bearish signal, but it does show that sellers currently have more evidence on their side unless buyers reclaim the key repair zones.
As I was reading that brokers like FxPro and Exness have introduced SpaceX CFDs and heard a guy on social media that was cheering to short that baby, I said, ok, it's time for me to deep dive into the new darling. So I did. As we know, the IPO itself was wonderful for the bulls, not to mention for Elon Musk, Peter Thiel and many others.
What changed after the SpaceX IPO rally?
The first stage of SPCX trading was genuinely bullish. From the IPO opening area near $150, SpaceX stock pushed as high as $225.64, a very large early extension for a newly listed mega-cap stock.
That matters because this is not a washed-out stock. It is still a highly extended post-IPO name that is now testing whether the first euphoric value zone is being rejected.
What stands out to me is the shift in behavior after the rally. Earlier, buyers accepted higher prices. Later, sellers started using the upper zone more aggressively. That is often where a hot IPO changes from “strong momentum” into “extension risk.”
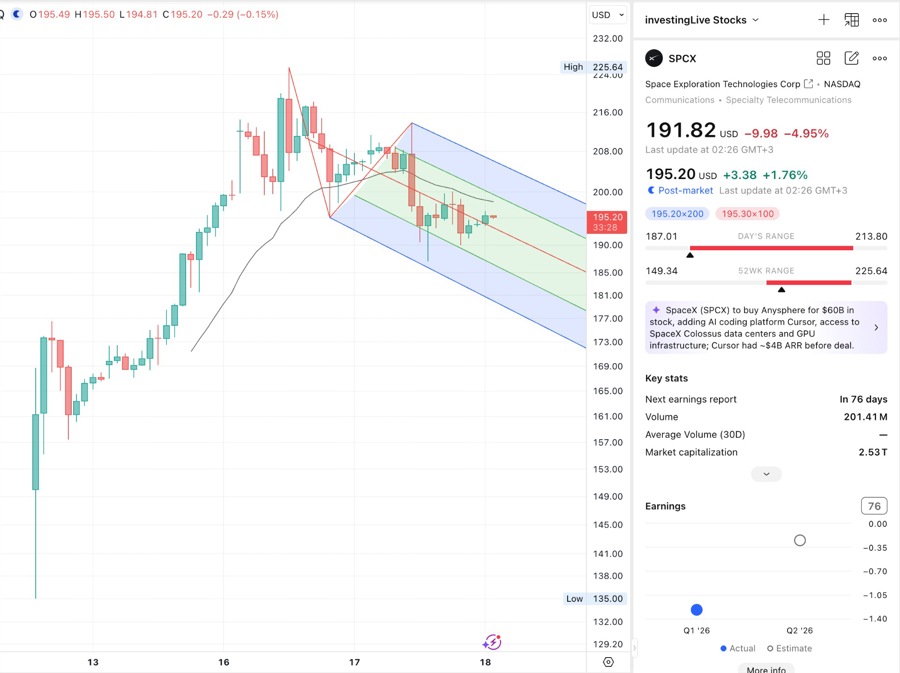
In my 1-hour chart of SPCX, the aggressive post-IPO impulse wave peaked at 225.64, and the market is currently consolidating that massive move inside a clean descending corrective channel. We are currently trading around 195.20, compressing right around the median lines of my pitchfork as the market digests the news of the $60B Anysphere acquisition.
Here is how my technical tools are framing this structure:
The 20 EMA: During the initial impulse move up from the 135 low, the 20 EMA acted as a clean dynamic support layer. However, once price broke below it on the 17th, the slope flattened, and the 20 EMA has transitioned into short-term overhead dynamic resistance, capping the recent intraday bounce attempts.
The Modified Schiff Pitchfork: I applied the modified Schiff pitchfork to map the boundaries of this corrective swing. The price is currently respecting the upper half of the pitchfork geometry, grinding lower along the internal median lines. A clean hourly close back above the 20 EMA and the upper pitchfork parallel line would signal a structural breakout of this flag.
Educational Insight: Standard vs. Modified Schiff Pitchfork
When an asset experiences a hyper-impulsive move followed by a sharp, shallow retracement, a standard Andrews Pitchfork is often far too steep to capture the true boundaries of the ensuing consolidation.
The Modified Schiff Pitchfork solves this by shifting the original anchor point (Point A) by half the vertical distance and half the horizontal distance toward the first swing high (Point B). This creates a flatter, more realistic angle of orientation that is uniquely suited for mapping out post-impulse flag or pennant consolidations without the lines becoming too vertical to be useful.
According to the Chartered Market Technician (CMT) Level II curriculum on geometric chart patterns, modifying the pitchfork’s origin point alters the slope to match the velocity of the corrective phase, making it highly effective for identifying hidden support and resistance lines during a grinding counter-trend regime. at investingLive.com, I also use that for channels and found those quite effective.
What does the 4-hour SPCX chart show at the end of 18 June, 2026?
The 4h structure shows a clear transition from launch demand into failed upper-value acceptance.
| Stage | Evidence | Interpretation |
|---|---|---|
| IPO launch | Strong positive delta and heavy buy volume in the opening 4h structure | Real launch demand |
| Early warning | Very large volume but only modest positive delta on the second 4h bar | Supply appeared into strength |
| Acceptance up | POC migrated higher through $169.50, $172.50, $184.50, then $193.50 | Buyers initially accepted higher value |
| Blow-off zone | Price reached $225.64, but delta weakened and upper value did not hold | Momentum became vulnerable |
| Failed repair | Price pushed back toward $208-$214, then rejected sharply | Sellers used the bounce |
| Current lower value | Price migrated back toward $193.50-$196.50 | New battleground zone |
The key 4h message is simple: SPCX accepted higher prices first, but then rejected the $208-$214+ value zone. That makes the current bounce a repair attempt, not yet a confirmed bullish reset.
What does the 1-hour SPCX chart show now?
The most important 1h event was the rejection bar near the upper failed-repair zone.
SPCX traded into the $207.50-$213.80 area, built volume near the highs, and then closed much lower. That is usually not healthy action. It suggests that sellers were willing to hit bids after price revisited the old upper zone.
The next move lower brought price toward $187.01, where buyers did defend the first flush. That defense matters. It prevents the read from becoming a clean breakdown call.
But the bounce is still not strong enough to call a bullish reset.
The latest 1h repair remains below:
$198.50-$200.40, the first tactical repair zone.
$202.50-$202.60, the first meaningful reclaim shelf.
$208.50-$214.50, the major failed upper-value zone.
What this means: buyers have stabilized the stock, but they have not yet taken back control.
Why this weakness looks SPCX-specific, not only Nasdaq-driven
Nasdaq weakness can amplify the move, but the SPCX decline looks more specific than just broad market beta.
The relative comparison matters because a new IPO can fall for different reasons:
The whole market may be weak.
Retail enthusiasm may cool.
Early buyers may take profits.
Late buyers may get trapped near the first euphoric highs.
Institutions may wait for lower prices before stepping in.
In this case, SPCX underperformed both the broader Nasdaq futures context and the space-themed benchmark comparison in the supplied data. That makes me less willing to dismiss the move as just a normal market pullback.
What are the key SpaceX stock levels to watch?
| Area | Level | Why it matters |
|---|---|---|
| Current lower value | $193.50-$196.50 | Main battleground after the rejection |
| First repair zone | $198.50-$200.40 | Recent POC plus tactical basis area |
| First meaningful reclaim | $202.50-$202.60 | Bulls need acceptance above this to reduce bearish pressure |
| Failed-repair transition | $205.95-$208.50 | Price begins testing the old supply area |
| Major supply zone | $209.95-$214.50 | Sellers previously used this area aggressively |
| Blow-off zone | $218.20-$225.64 | Prior post-IPO extension and profit-taking zone |
| First downside support | $190-$187 | Key flush area and short-term defense zone |
| Deeper downside magnet | $178.50-$176.50 | Prior breakout area if $187 fails |
| Earlier IPO value | $172.50-$169.50 | Earlier accepted value zone |
| Deeper failure area | $160.50 | Earlier IPO POC zone if selling accelerates |
tradeCompass map for SPCX stock traders
| Scenario | Activation | Target area | Invalidation |
|---|---|---|---|
| Bearish failed repair | Failed bounce into $198.50-$202.60 | $190-$187, then $178.50-$176.50 | Sustained acceptance above $202.60 |
| Deeper bearish continuation | Breakdown and retest below $187 | $178.50-$176.50, then $172.50-$169.50 | Fast reclaim above $190-$193.50 |
| Aggressive bullish bounce | False break below $187, then reclaim of $190-$193.50 | $198.50-$202.60 | Failure back below $187 |
| Higher-quality bullish repair | Acceptance above $202.60 | $208.50-$214.50 | Rejection back below $198.50 |
| Bullish reset attempt | Acceptance above $208.50 with stronger order flow | $218.20-$225.64 | Loss of $202.60 |
The cleanest bearish setup is not a panic short into $190-$187. It is a failed bounce into $198.50-$202.60, especially if sellers reappear and price fails back below $198.50.
The cleaner bullish case requires more proof. A bounce from $187 is useful, but a bullish reset needs acceptance above $202.60, and stronger confirmation above $208.50.
What would change my mind on SPCX?
I would upgrade SPCX from bearish-leaning to more neutral if price accepts above $202.60 and holds that area on pullbacks.
I would upgrade it to a tactical bullish repair if price accepts above $208.50 with stronger buy-side participation and higher POC migration. A wick above that level is not enough. I would want to see the market actually spend time above the level and defend it.
I would turn more bearish if $187 breaks and then becomes resistance from below. That would suggest the first lower-zone defense failed.
How to know if this SpaceX stock analysis is still valid
This analysis is most useful while SPCX is still trading around the levels in the map.
If price is still between $193.50 and $202.60, the stock remains in the decision zone. In that area, traders should be careful with chasing because both failed breakdowns and failed bounces are possible.
If SPCX has already accepted above $208.50, this article should no longer be treated as bearish. It would mean buyers have repaired the failed upper-value zone.
If SPCX has broken below $187 and is holding below it, the bearish scenario has already moved to the next stage, and traders should avoid treating the original short setup as fresh.
Practical decision support view
My current classification is:
SPCX is tradeable with confirmation, but bearish-leaning after a failed upper-value repair.
The stock is not a clean breakdown because $187 held on the first flush and the latest 1h bars show some stabilization.
But it is also not a clean long because price is still below the important reclaim area at $198.50-$202.60, and far below the major failed upper-value zone at $208.50-$214.50.
My preferred playbook:
Do not chase short directly into $190-$187 unless $187 breaks and retests from below.
Watch for a failed bounce into $198.50-$202.60 for the cleaner short setup.
Upgrade to neutral if SPCX reclaims and accepts above $202.60.
Upgrade to bullish tactical repair only if SPCX accepts above $208.50 with stronger order flow and higher POC migration.
For now, the better read is short bias on failed repair, not blind short-at-low.
FAQ
Is SpaceX stock bullish or bearish after the IPO?
SPCX is bearish-leaning in the current technical read because it failed to hold the upper post-IPO value zone near $208-$214. However, it is not a clean breakdown unless $187 fails and price accepts lower.
What is the most important SPCX resistance level?
The first important resistance zone is $198.50-$202.60. A stronger bullish repair would require acceptance above $208.50.
What is the most important SPCX support level?
The first major support area is $190-$187. If $187 fails and turns into resistance, the next downside magnets are $178.50-$176.50 and $172.50-$169.50.
Is SPCX a buy after the pullback?
I would not frame SPCX as an automatic buy after the pullback. The bullish case improves only if price reclaims $202.60, and becomes more convincing if it accepts above $208.50 with stronger order flow.


