
FUNDAMENTAL OVERVIEW
USD:
The US dollar regained some ground this week as US and Iran rejected the respective war-ending proposals and US inflation data came out higher than expected. Overall, the market remains rangebound as traders continue to wait for new developments before picking a direction.
Looking ahead, the Fed is slowly abandoning the easing bias with more and more policymakers talking about the need of keeping all options on the table and some explicitly bringing up rate hikes.
The reopening of the Strait could weigh on the greenback in the short-term as oil prices will likely fall quickly and rate cut bets will increase on easing inflation worries.
After that though, the focus will quickly turn back to the Fed and the economic data. With the end of the war, the increase in economic activity could keep inflation higher for longer and eventually even require rate hikes to bring it sustainably back to the 2% target that the Fed has been missing since 2021.
There’s also another scenario where the Strait remains closed for longer and oil prices stay elevated, with the risk that the Fed turns hawkish anyway and gives the greenback a strong boost given the bearish positioning on the dollar.
INR:
On the INR side, the lack of any US-Iran breakthrough and a rebound in oil prices continued to weigh on the Indian Rupee which dropped to a new record low against the dollar this week.
In the short-term, the Rupee has been closely correlated with oil prices, so positive developments on the US-Iran front should keep giving the INR a boost. Conversely, extended stalemate or further escalations will likely keep weighing on the currency and push it into new record lows.
In the big picture, the Indian Rupee remains on a bearish structural trend against the US dollar, so the dip-buyers will likely look for opportunities around strong technical levels to keep pushing into new highs.
USDINR TECHNICAL ANALYSIS – DAILY TIMEFRAME
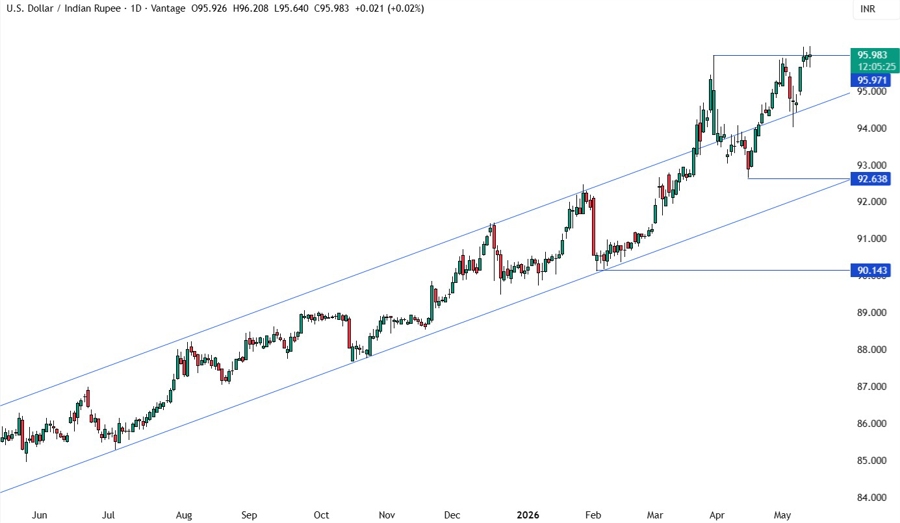
On the daily chart, we can see that USDINR reached a new record high this week as the Rupee slide extended further. The price is now consolidating around the all-time highs, so there’s not much we can see here. We need to zoom in to see some more details.
USDINR TECHNICAL ANALYSIS – 4 HOUR TIMEFRAME
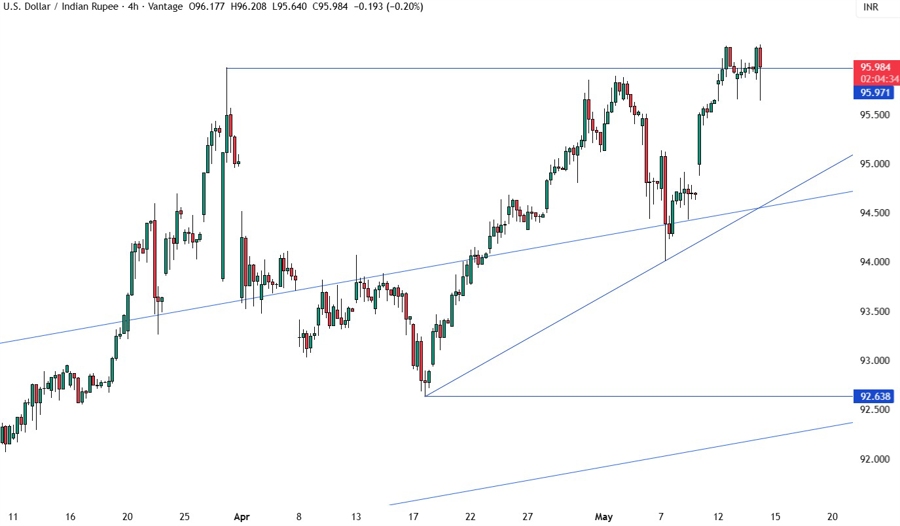
On the 4 hour chart, we can see more clearly the consolidation around the all-time highs. From a risk management perspective, the buyers will have a better risk to reward setup around the trendline to keep pushing into new highs. The sellers, on the other hand, will need a break below the trendline and the upper bound of the channel to open the door for new lows.
USDINR TECHNICAL ANALYSIS – 1 HOUR TIMEFRAME
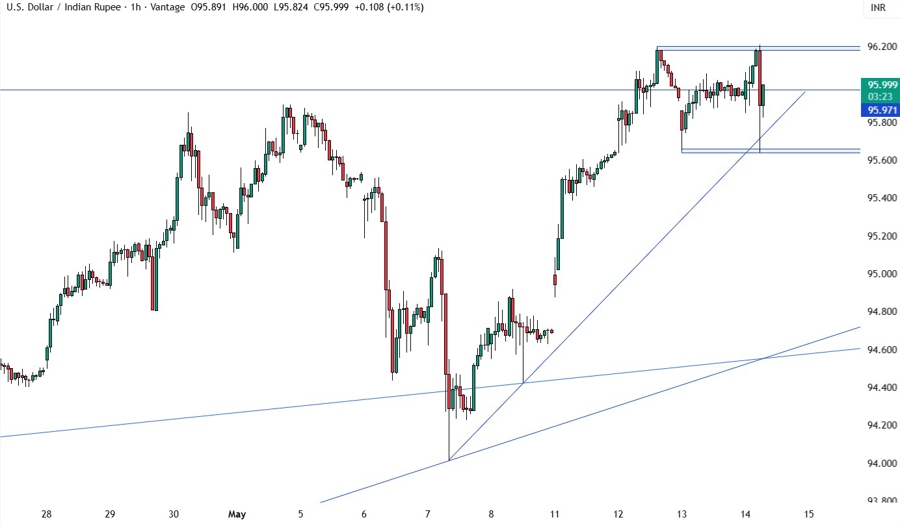
On the 1 hour chart, we have a tight range between the 95.65 support and 96.20 resistance. The buyers will continue to step in around the support to keep pushing into new highs and increase the bullish bets on a break above the resistance. The sellers, on the other hand, will need a break below the support to extend the pullback into the trendline around the 94.80 level.
UPCOMING CATALYSTS
Today we get the US Retail Sales report and the latest US Jobless Claims figures.


