
FUNDAMENTAL OVERVIEW
Silver has been diverging with gold recently as it’s been rallying steadily since last week. They are generally correlated but can decouple sometimes. Silver is also much more volatile, so it might just be exacerbating the boost from falling real yields.
The fundamentals haven’t changed. We still have the US and Iran in a deadlock. We still have high inflation and oil prices. And we still have the Fed slowly turning more hawkish.
Traders will need to focus on the Fed going forward as new all-time highs are unlikely to come without an easing bias from the central bank. If nothing changes before the June meeting, we might be in for a hawkish surprise as inflation continues to run hot and the US data remains resilient. In that case, we can expect a selloff in silver and potentially new lows.
In the short-term, a resolution and the reopening of the Strait will likely support silver on falling oil prices and increased rate cut bets as inflation worries would ease. But if the Strait remains closed for longer and oil prices stay elevated, the risk of the Fed turning hawkish anyway increases.
SILVER TECHNICAL ANALYSIS – DAILY TIMEFRAME
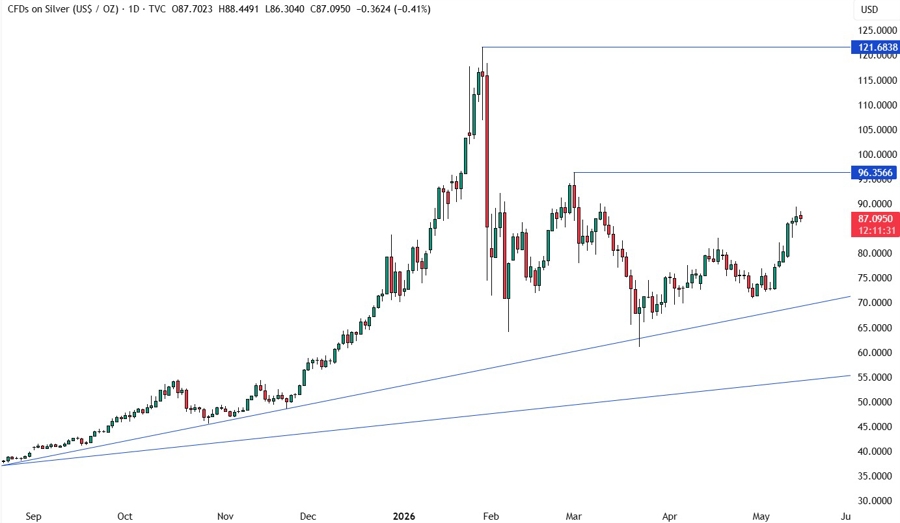
On the daily chart, we can see that silver has been rallying steadily for more than a week now, with the price approaching the key 96.00 handle. If it gets there, we can expect the sellers to step in with a defined risk above the level to position for a drop back into the major trendline. The buyers, on the other hand, will look for a break to increase the bullish bets into the cycle highs.
SILVER TECHNICAL ANALYSIS – 4 HOUR TIMEFRAME
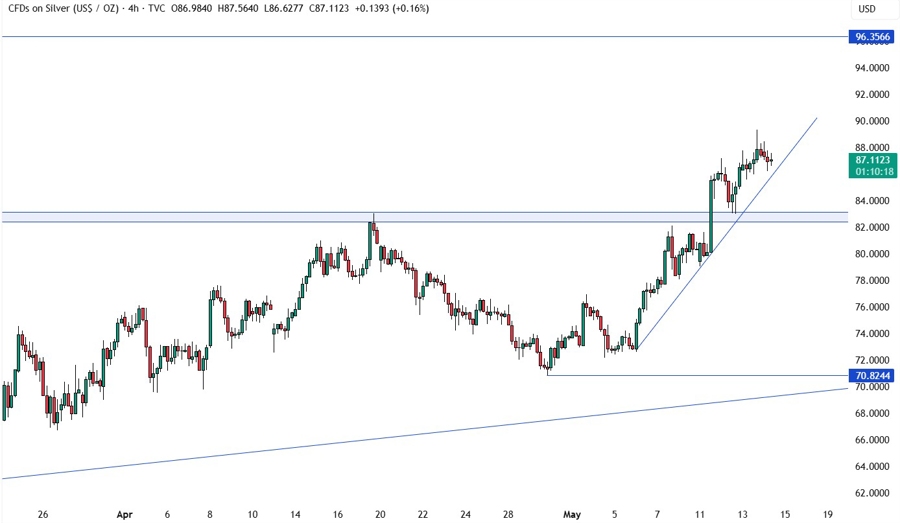
On the 4 hour chart, we have an upward trendline defining the bullish momentum. The buyers will likely continue to lean on the trendline with a defined risk below it to keep pushing into the 96.00 level. The sellers, on the other hand, will look for a break to pile in for a pullback into the 83.00 support.
SILVER TECHNICAL ANALYSIS – 1 HOUR TIMEFRAME
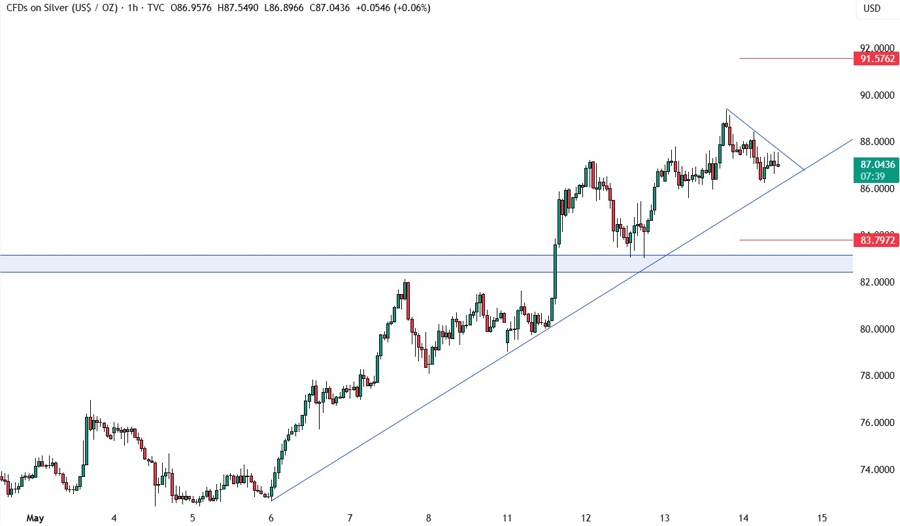
On the 1 hour chart, we have a minor counter-trendline defining the pullback into the upward trendline. The sellers will likely continue to lean on it with a defined risk above it to keep pushing for a break below the upward trendline. The buyers, on the other hand, will look for a break above the downward trendline to increase the bullish bets into new highs. The red lines define the average daily range for today.
UPCOMING CATALYSTS
Today we get the US Retail Sales report and the latest US Jobless Claims figures.


