
FUNDAMENTAL OVERVIEW
Gold has come under renewed pressure on Tuesday after the markets got a bit scared following Iran’s refusal to participate in the Islamabad talks due to the US blockade in the Strait of Hormuz.
Most of the losses were then pared after Trump extended the ceasefire to allow more time for Iran to put forward a proposal to end the war but didn’t lift the blockade. There's no deadline for this latest extension, so we might just get stuck in this new situation until the bombs start dropping again or they finally reach a deal.
For now, the short-term bias is neutral to bearish as we head into the weekend without clear signs of improved relations. Nonetheless, the downside should remain limited amid positive expectations and a resolution should trigger a rally towards the 5,000 level. On the other hand, if the war resumes, gold prices are likely to quickly fall back into the 4,000 level.
GOLD TECHNICAL ANALYSIS – DAILY TIMEFRAME
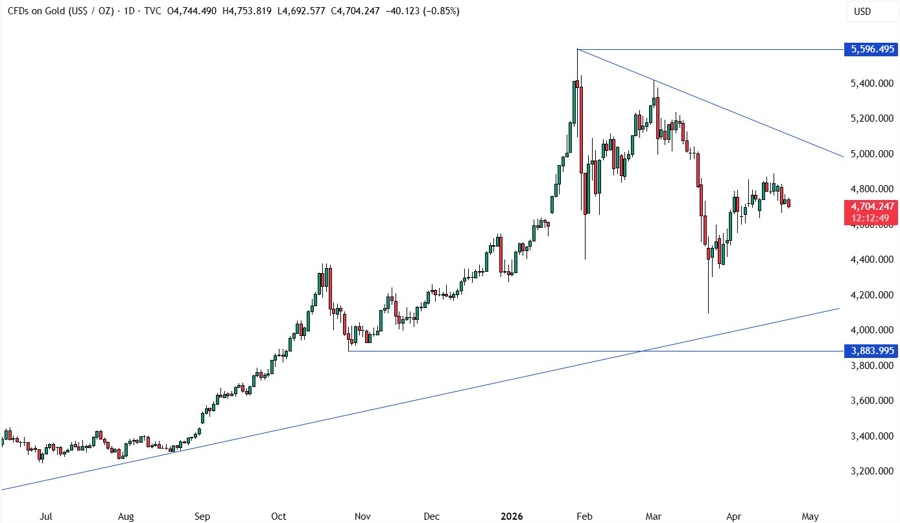
On the daily chart, we can see that gold is just consolidating awaiting new catalysts to push it into either direction. Right now, we are trading around the same levels we’ve been at the start of the month. The natural target for the buyers should be the downward trendline around the 5,000 level. If the price gets there, we can expect the sellers to lean on the trendline with a defined risk above it to position for a drop into the major upward trendline around the 4,100 level. The buyers, on the other hand, will look for a break higher to increase the bullish bets into the 5,400 level next.
GOLD TECHNICAL ANALYSIS – 4 HOUR TIMEFRAME
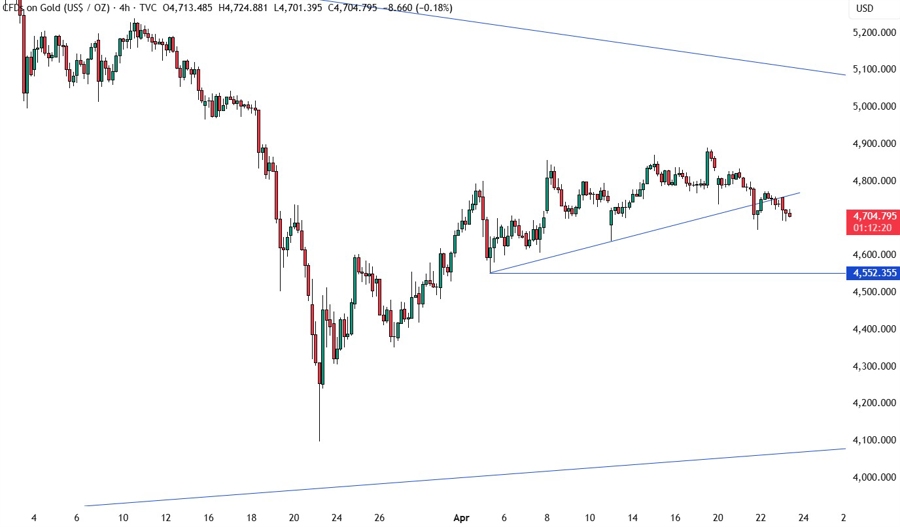
On the 4 hour chart, we can see the price broke below the upward trendline and opened the door for a bigger pullback into the 4,550 level. If the price gets there, we can expect the buyers to step in with a defined risk below the level to position for a rally into the major downward trendline. The sellers, on the other hand, will look for a break lower to increase the bearish bets into new lows.
GOLD TECHNICAL ANALYSIS – 1 HOUR TIMEFRAME
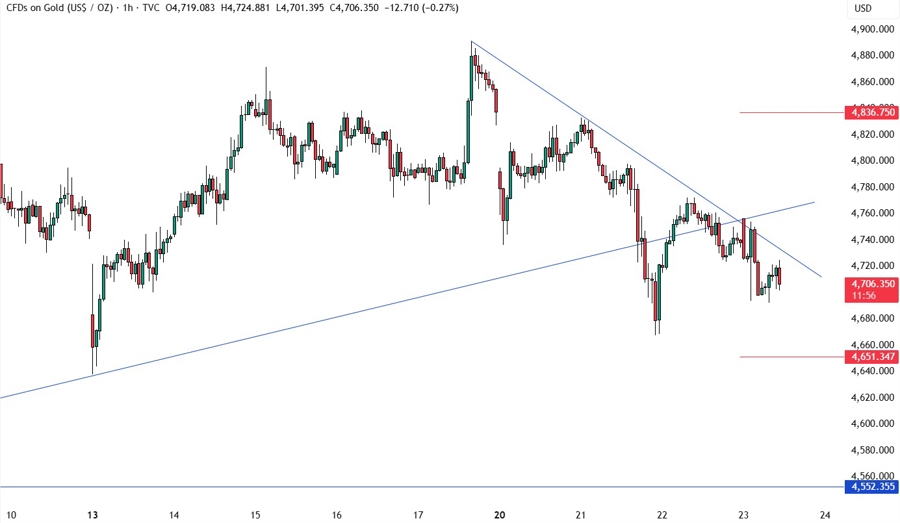
On the 1 hour chart, we have a minor downward trendline defining the current pullback. The sellers will likely continue to lean on the trendline to keep pushing into new lows, while the buyers will look for a break to pile in for a rally into new highs. The red lines define the average daily range for today.
UPCOMING CATALYSTS
Today we get the latest US Jobless Claims figures and the US PMIs, but the market focus remains on US-Iran headlines.


