E
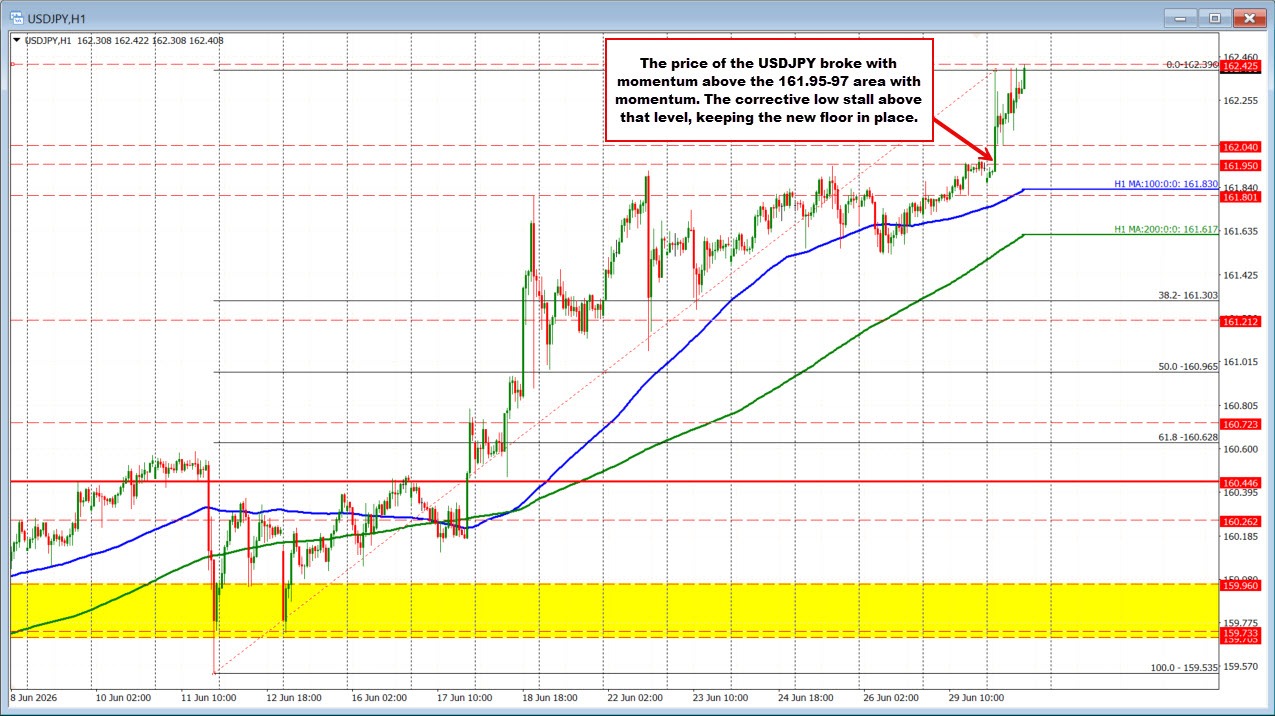
The USD is mostly higher with the USDJPY up 0.27% and breaking through the 40 year ceiling near 161.95-97. The price moved above the key ceiling with more momentum in the Asian Pacific session and quickly extended to a high or 162.396. The price corrected lower but stayed above the 161.95-97 area at 162.04. The price has subsequently pushed to a high of 162.42. Buyers are in control. Shorts are getting squeezed.
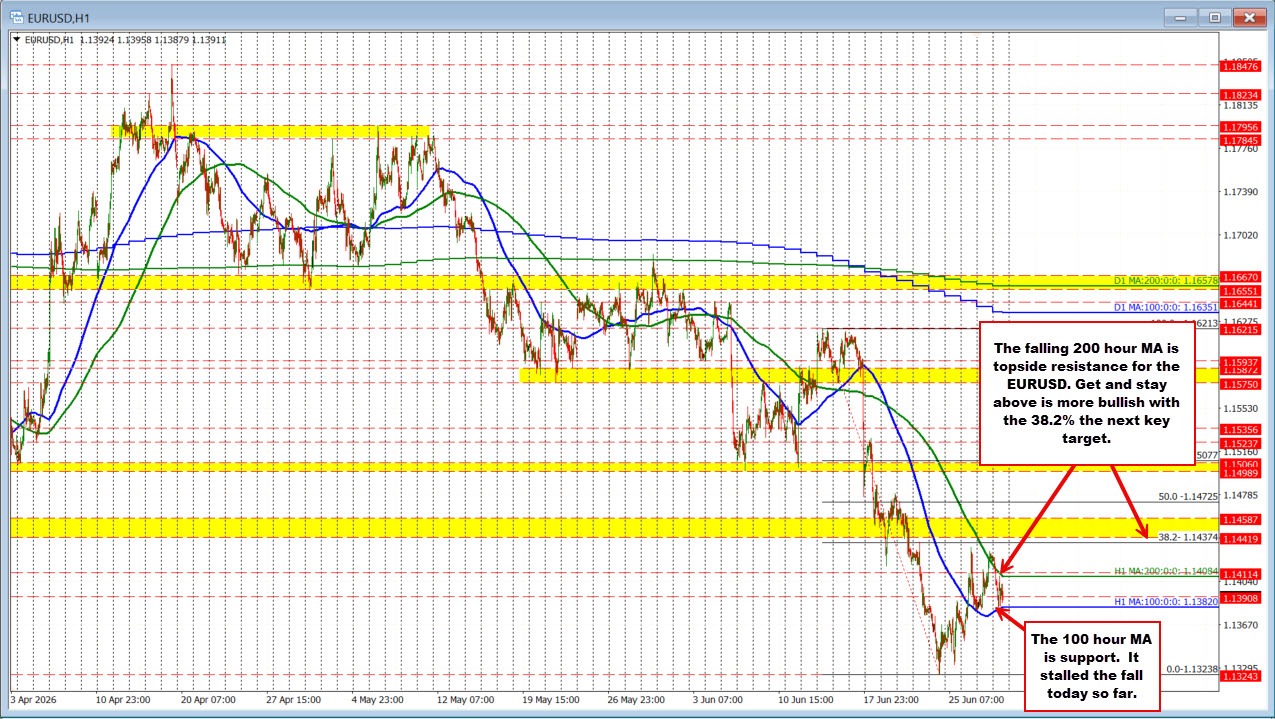
The technical picture for the EURUSD remains largely unchanged. Yesterday, the pair extended its rebound from the 100-hour moving average and briefly pushed above the higher, but still falling, 200-hour moving average, currently at 1.14084. However, the upside momentum could not be sustained, and the price has since slipped back into the range between the two key moving averages.
On the downside, sellers pushed the pair back toward the 100-hour moving average at 1.1382, but buyers stepped in once again to defend that level. As a result, the 100-hour moving average continues to act as key support, while the 200-hour moving average remains an important resistance barrier.
With the pair trapped between these two technical levels, traders are awaiting a decisive break and sustained move outside the range to provide the next directional clue. A move above the 200-hour moving average would tilt the bias back in favor of the buyers, while a break below the 100-hour moving average would give sellers greater control.
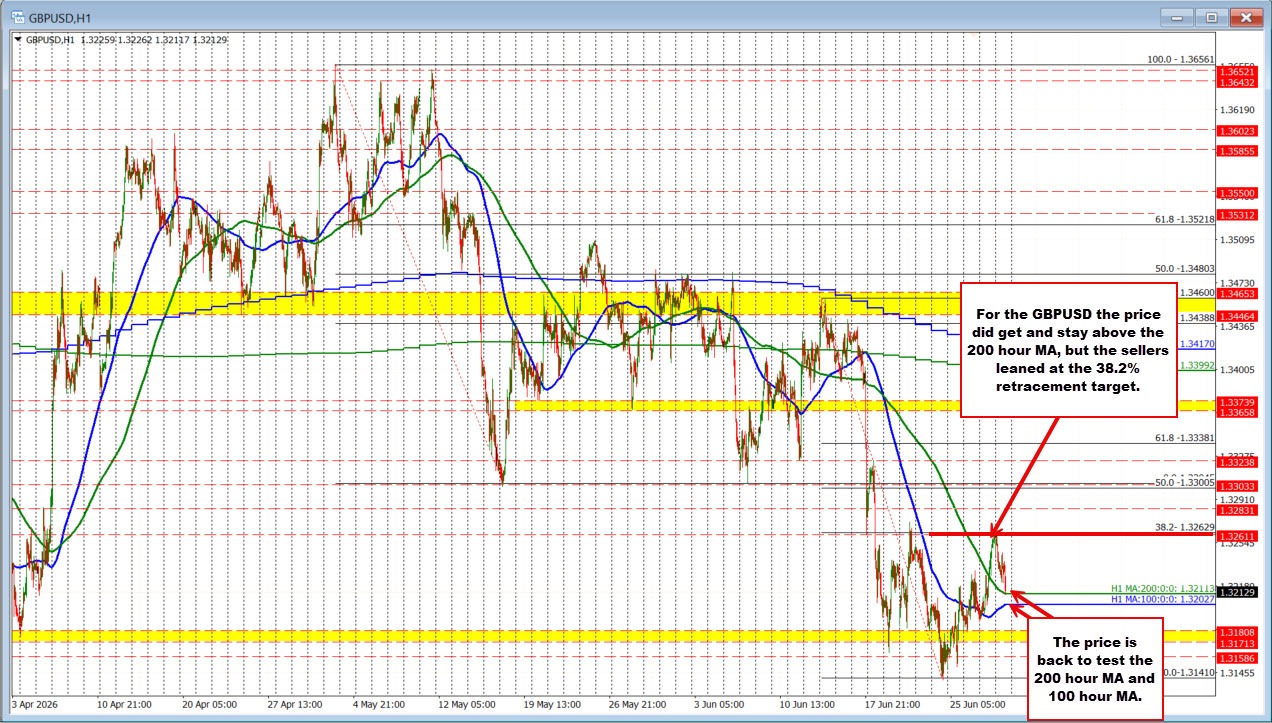
Unlike the EURUSD, the GBPUSD was able to break above its 200-hour moving average and hold above that key level. However, the rally stalled ahead of the next upside target—the 38.2% retracement of the decline from the June 15 high—which comes in at 1.32629.
After failing to extend higher, the pair rotated back to the downside and is now retesting its 200-hour moving average at the start of the North American session, currently at 1.32113. Just below that level sits the rising 100-hour moving average at 1.32027, creating an important support zone for buyers.
As long as the price remains above the 100- and 200-hour moving averages, buyers retain a modest near-term advantage. However, a break back below both levels would shift the bias back toward the sellers and increase the risk of a deeper correction.
The RBA meeting minutes from the last meeting on June 16 were released. The RBA kept rates unchanged after 3 previous hikes which took the price back to the prior high. The Reserve Bank of Australia maintained a hawkish bias, emphasizing that monetary policy needs to remain restrictive and that further rate hikes remain possible if inflation proves persistent. The board highlighted that headline inflation at 4.0% and core inflation at 3.6% remain well above its 2%-3% target range, while excess demand in the economy and weak productivity growth continue to pose risks to the inflation outlook. Policymakers also noted that the housing market has softened more than expected, with falling home prices in Sydney and Melbourne presenting a downside risk to growth. The minutes, however, predated last week's more than 10% decline in Brent crude prices, creating a disconnect between the RBA's hawkish tone and market expectations. Investors now see only limited scope for further tightening and have begun pricing in modest rate cuts through 2027, reflecting the view that lower energy prices could ease inflation pressures and that Australian interest rates may have already peaked.
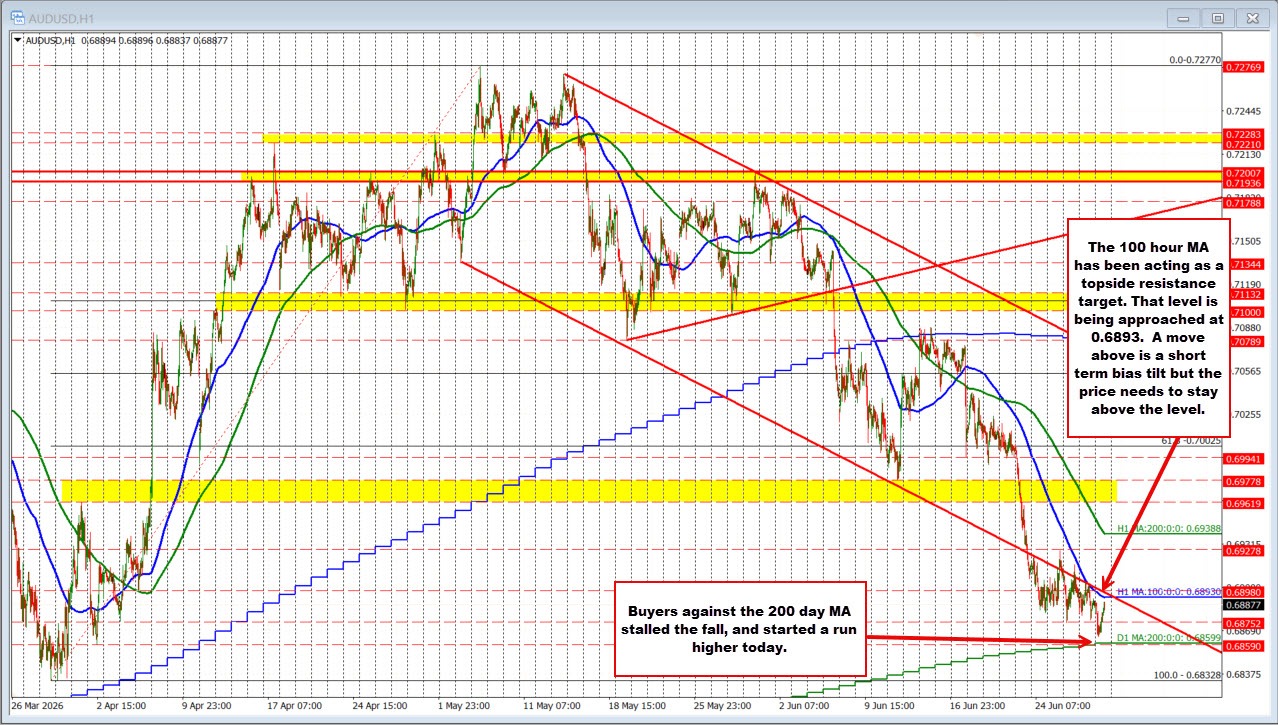
The AUDUSD is little changed on the day after earlier falling to its lowest level since April 2, reaching 0.6866. The decline brought the pair within a few pips of its rising 200-day moving average at 0.68599, where dip buyers stepped in to defend the key support level.
The subsequent rebound has the pair moving back toward the falling 100-hour moving average at 0.6893, a level that has capped rallies over the past several sessions. A break above the 100-hour moving average would give buyers a modest near-term advantage, but they would need to sustain momentum above that level and ultimately push through the 200-hour moving average, currently at 0.69388, to shift the broader technical bias back in their favor.
Looking at the US stocks, the indices are higher in pre-market futures trading
- Dow industrial average is up 205 points
- S&P is up 20.07 points
- Nasdaqq is up 46 points
In the US debt market, the yields are modestly higher:
- 2 year yield 4.114%, +0.5 basis points
- 5 year yield 4.149%, up 0.5 basis points
- 10 year yield 4.382%, up 0.8 basis points
- 30 year yield 4.867%, up 0.0 basis points.
In other markets:
- Crude oil is trading near unchanged at $70.77. The low reached $69.75. The high was at $71.18. Trump criticized retailers for keeping the price of gas high. On February 27 the day before the war started AAA gallon of gas was at $2.98. The current price is at $3.84. The price of crude oil was at $67.28. Kushner and Whitkopf are in Doha for talks
- Gold is trading up $15.20 or 0.37% at $4030.93 despite the USD and modest yield rise today.
- Silver is trading up $0.75 or 1.27% at $58.98
- Bitcoin is trading back below the $60,000 level at $59,100
The economic calander will be highlighted by the JOLTs job openings and home price information from various sources
- 08:30 ET – Canada GDP MM (Apr): Expected 0.40% vs prior -0.10%
- 09:00 ET – U.S. Monthly Home Price MM (Apr): Prior 0.1% (no consensus estimate)
- 09:00 ET – U.S. Monthly Home Price YY (Apr): Prior 1.7% (no consensus estimate)
- 09:00 ET – U.S. Monthly Home Price Index (Apr): Prior 441.5 (no consensus estimate)
- 09:00 ET – U.S. Case-Shiller 20-City MM SA (Apr): Expected -0.1% vs prior -0.2%
- 09:00 ET – U.S. Case-Shiller 20-City MM NSA (Apr): Prior 1.0% (no consensus estimate)
- 09:00 ET – U.S. Case-Shiller 20-City YY NSA (Apr): Expected 0.9% vs prior 0.8%
- 09:45 ET – U.S. Chicago PMI (Jun): Expected 56.0 vs prior 62.7
- 10:00 ET – U.S. Consumer Confidence (Jun): Expected 94.8 vs prior 93.1
- 10:00 ET – U.S. JOLTS Job Openings (May): Expected 7.300M vs prior 7.618M


