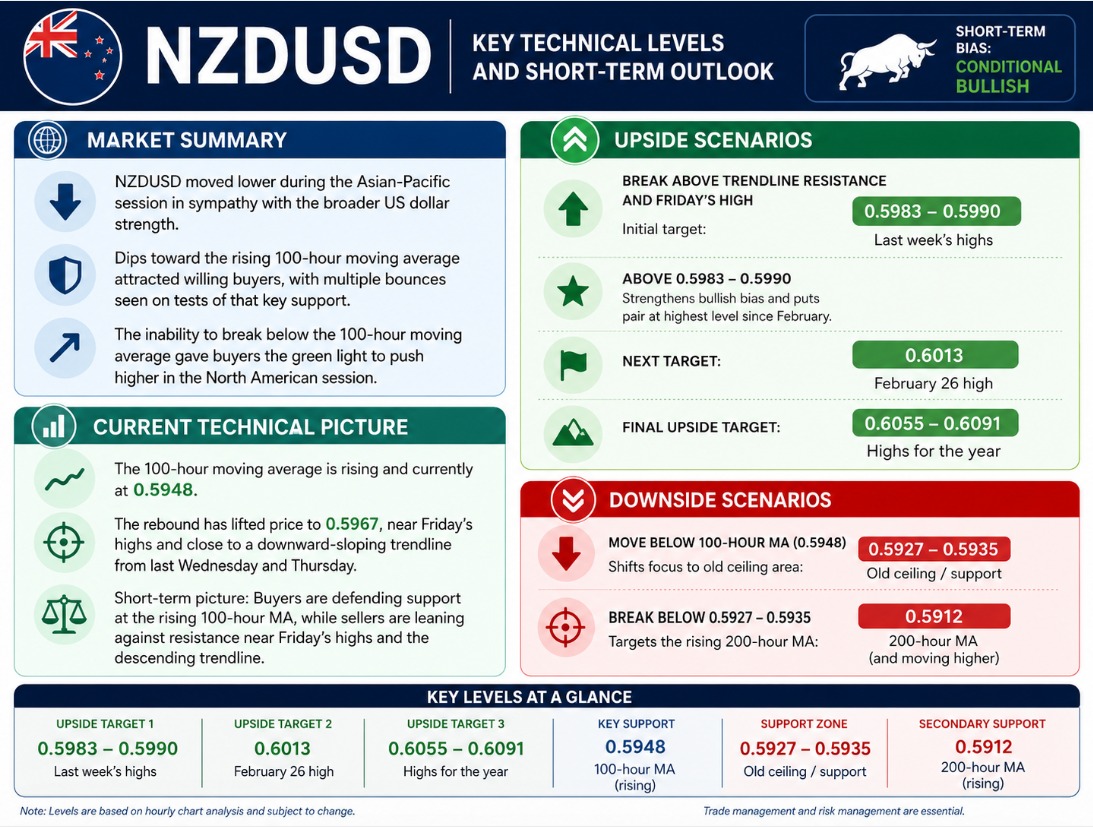
The NZDUSD moved lower during the Asian-Pacific session in sympathy with the broader US dollar strength. However, each dip toward the rising 100-hour moving average attracted willing buyers, with the pair bouncing on several separate tests of that key support level. The inability to break below the 100-hour moving average helped give buyers the green light to push the pair higher during the North American session.
The 100-hour moving average currently comes in at 0.5948 and continues to trend higher. The rebound has taken the price up to 0.5967, putting the pair near the highs from Friday’s trade and close to a downward-sloping trendline connecting the highs from last Wednesday and Thursday on the hourly chart.
As a result, the technical picture is becoming well defined in the short term: buyers are successfully defending support against the rising 100-hour moving average, while sellers are leaning against resistance near Friday’s highs and the descending trendline resistance from last week.
If buyers can break above the trendline resistance and Friday’s high, traders would begin targeting last week’s highs between 0.5983 and 0.5990. A move above that zone would strengthen the bullish bias further and put the pair at its highest level since February. Beyond that, the next upside targets come in near the February 26 high at 0.6013, followed by the broader swing area between 0.6055 and 0.6091 — the highs for the year.
On the downside, a move back below the rising 100-hour moving average at 0.5948 would shift attention toward the old ceiling area between 0.5927 and 0.5935. If sellers can get below that level, the 200 hour moving average at 0.5912 (and moving higher) would be targeted.