In a video yesterday, I spoke to the resistance in the Nasdaq index near the 200 hour MA and also commented on how the QQQ ETF was testing its converged 100/200 hour MAs. You can revisit that post (and watch the video), by clicking below:
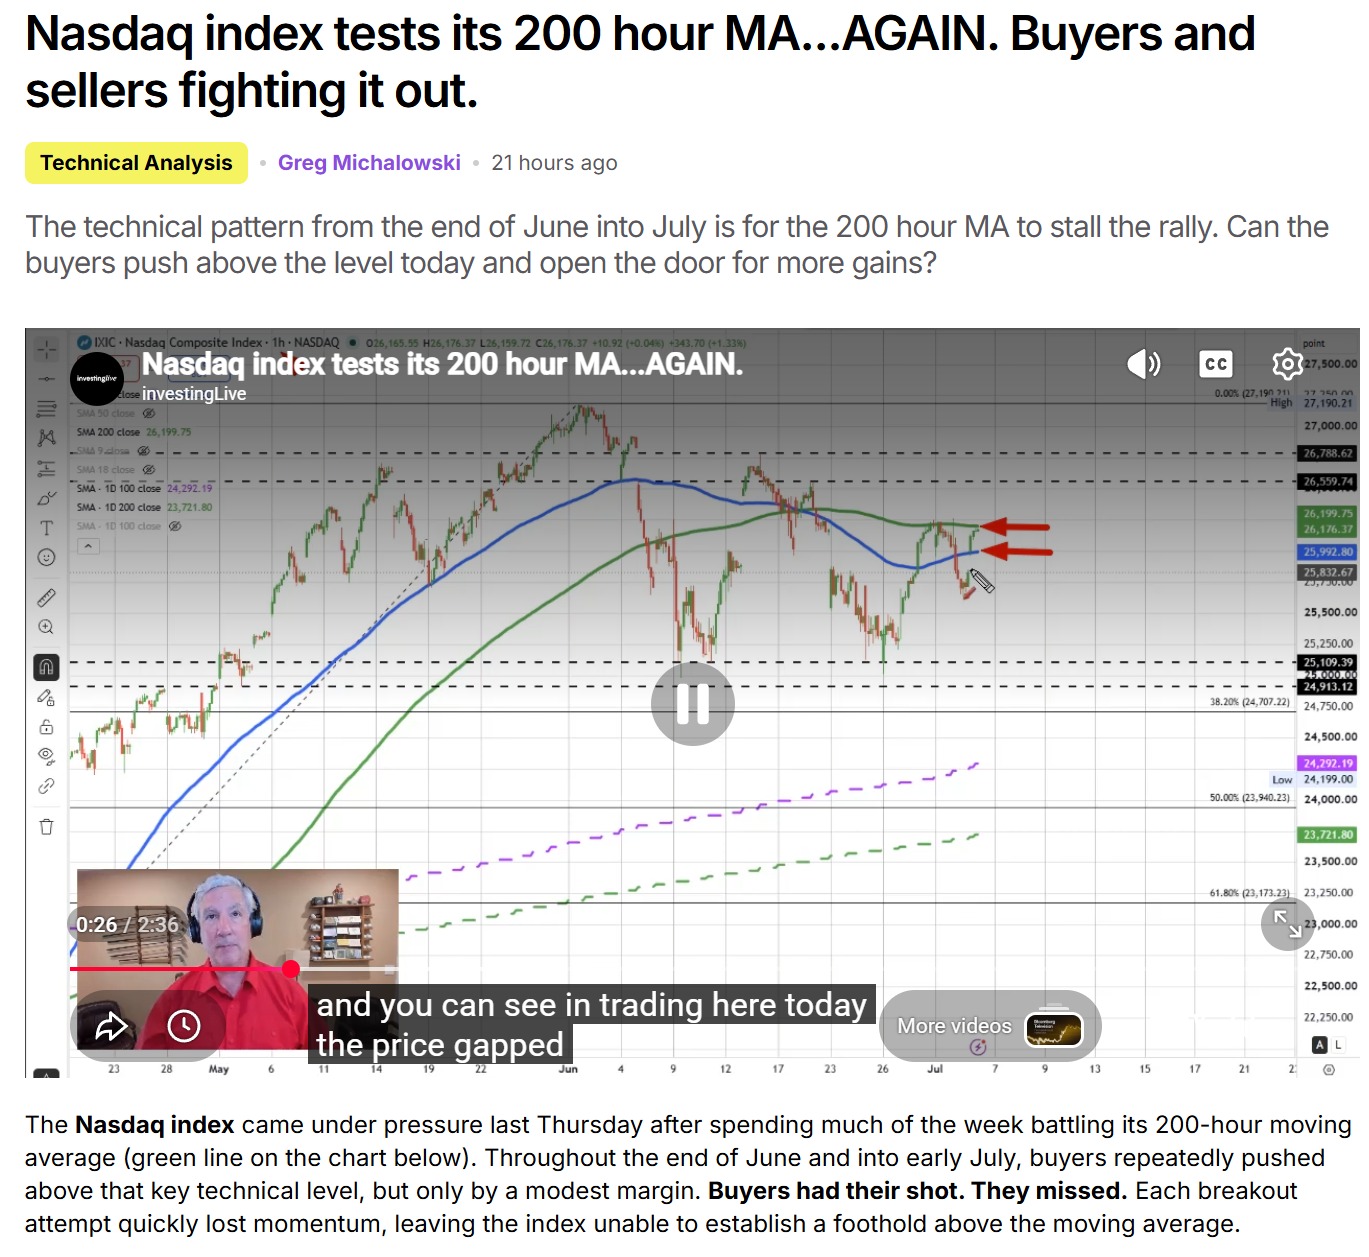
For those two indices, esch failed to extend above their key resistance targets, and today's selling has pushed both lower and are moving away.
A key truism in technical analysis/trading is that when a market tests resistance, and fails to break through, and then reverses lower, it is a bearish technical signal that suggests sellers are in firm control, buyers are losing momentum. That makes today's decline less surprising, but is also a warning to traders of the downside risks.
In the video below, I break down the technical picture for both indices, explain why those resistance levels remain so important, and outline the key price levels that will determine where the markets head next.