

Selling started at the start of the day. Momentum picked up in the NY session
Yesterday, I spoke of the EURJPY's test of the 200 week MA. I have the 200 week MA at 1.3065. Bloomberg had it a bit higher at 130.72. . The high price reached

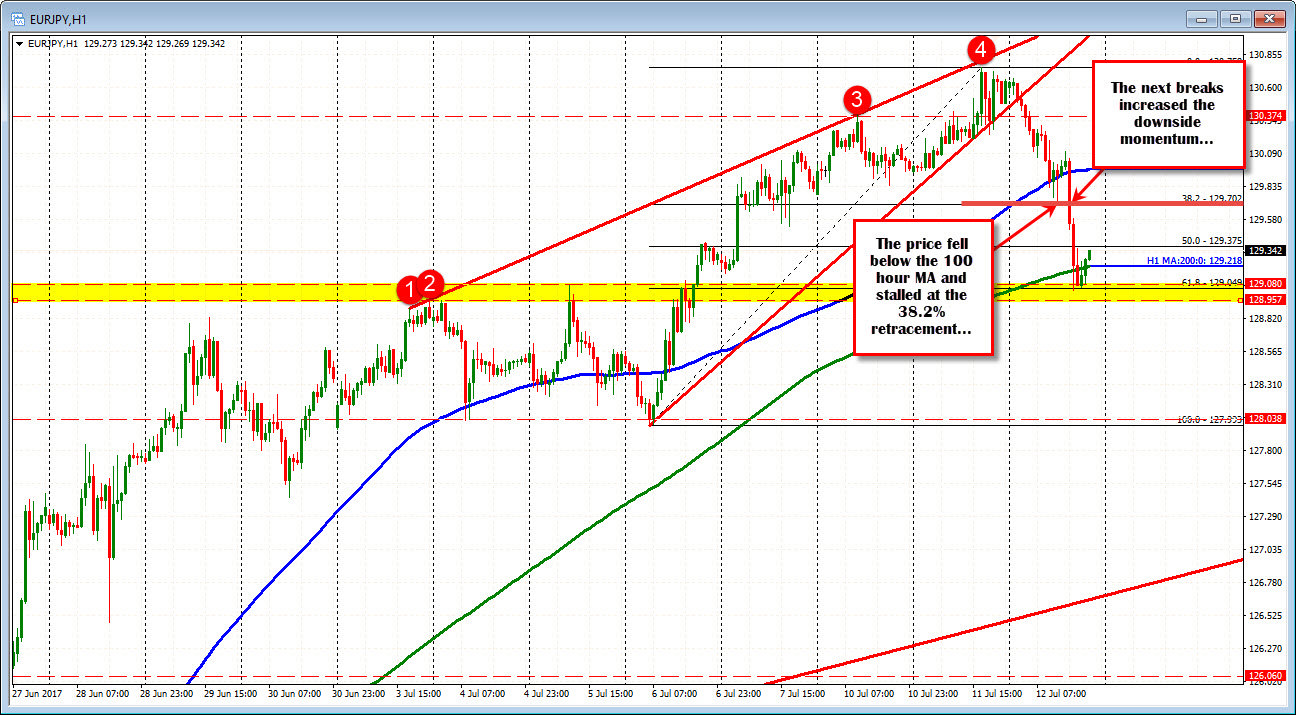
The high price peaked at 130.758. Looking at the hourly chart, the pair stalled ahead of a topside trend line (see red circle 4 on the chart below). Sellers started to lean against resistance.
From the high the price:
- Fell below trend line support near the highs (at 130.52).
- The fall moved below the 100 hour MA (blue line- it is currently at 129.966)
- The price fall stalled at the 38.2% retracement at 129.702.
- IN the NY session, the price fell below the 100 hour MA and 38.2%. That got the ball rolling again.
- The price moved to the 61.8% at 129.04. The 128.957 to 129.08 is home to swing highs (see yellow area). Now it uses the level as a support target.
What now?
We are bouncing off the yellow support area on the hourly chart and move back toward the 50% of the move up from the July 6th low at 129.375. That is a close risk level for the pair.
Overall, the EURJPY has moved about 170 pips from the high. Putting that move into perspective, the rise from the June low to July high yesterday was about 840 pips. The move higher had 16 up days, 3 down days and one unchanged day. Today is the first down day from high. It is the largest down day since May 17th (that was off a high that led to a 320 pip decline - see daily chart below).

Can the correction move lower? Sure. In its favor:
- Sellers near the 200 week MA
- Fall below the 100 hour MA
- Some close retracement levels broken (including the 38.2% and 50%).
Those are the steps that needed to be taken. Those traders that sold yesterday, with a stop above the highs are in the best short position.
Not in the favor of more of a move lower:
- 61.8% held
- Back above the 200 hour MA
What would keep the sellers more in control and the door open for a deeper correction? On the wide for this pair now would be the staying below the 100 hour MA at 129.966. A closer risk level would be 129.70. That level was a swing low from earlier today, and the 38.2% of the move up from the July 6th low. For shorts, putting a stop around those levels makes sense. A move above those levels, and it makes me question the bearish bias.
What is the reward on more selling?
The 38.2% of the last trend move higher from the June low comes in at 127.56 (see daily chart). That would represent a 320 decline from the high. Back in May, the move down from the high was about the same amount. That would certainly be a target for the shorts.