FUNDAMENTAL OVERVIEW
The Nasdaq was on the verge of a breakdown last week as continued escalations in the Strait of Hormuz and hawkish Fed expectations sapped market’s optimism. Everything changed on Thursday when Trump cancelled his planned attacks on Iran and announced a deal with confirming reports from the Iranian side. This surprising breakthrough triggered a strong reversal on expectations of lower oil prices, easing inflation concerns, lower risk of rate hikes and improved growth outlook.
In the short-term, the focus continues to be on this new development, so we can expect the bullish bias to hold (all else being equal) but the FOMC decision today remains a risk and that’s likely why we’ve been seeing some weakness since yesterday as traders hedge into the event.
The Fed is widely expected to keep interest rates unchanged and remove the easing bias from the statement. At this meeting, we will also get the Summary of Economic Projections (SEP) where inflation is expected to be revised higher while the unemployment rate could see a slight downtick in the short-term. The focus will be mostly on the dot plot which is expected to show no cuts this year and the next. All of this is expected and already priced in.
- You can find a comprehensive Fed preview here
The main hawkish surprises include a rate hike in the 2026 dot or more than one in 2027. In this scenario, we will likely see a selloff in the Nasdaq with the price falling back to pre-deal levels. On the other hand, the dovish surprises include a rate cut in the 2026 dot or in the 2027 dot as that would implicitly signal an easing bias. In such a scenario, we can expect the Nasdaq to rally into new record highs in the next days.
Fed Chair Warsh’s first press conference will also be in focus, although I would argue that the Board is going to be more important than the Fed Chair at least until the markets get to know him better and he proves to be independent. Trump just gave Warsh a big assist by ending the war, so he can say the Fed can look through the short-term increase in inflation.
Looking ahead, the risk is that the negative supply shock caused by the US-Iran war turns into a positive demand shock as the conflict ends that boosts economic activity further requiring rate hikes anyway. That’s likely to be the next tail risk.
NASDAQ TECHNICAL ANALYSIS – DAILY TIMEFRAME
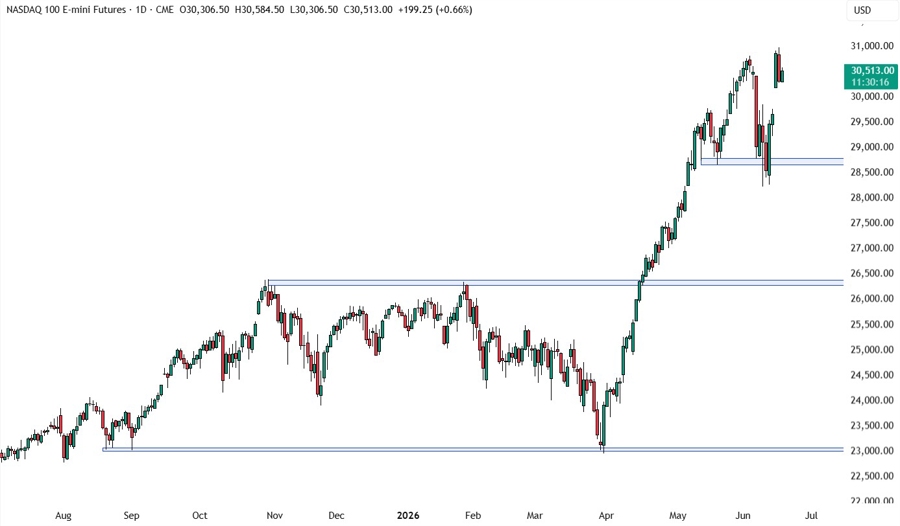
On the daily chart, we can see the Nasdaq probed below the key 28,700 support but eventually bounced back strongly on the surprising US-Iran breakthrough and extended the gains into new all-time highs as optimism grew. There’s not much we can glean from this timeframe, so we need to zoom in to see some more details.
NASDAQ TECHNICAL ANALYSIS – 4 HOUR TIMEFRAME
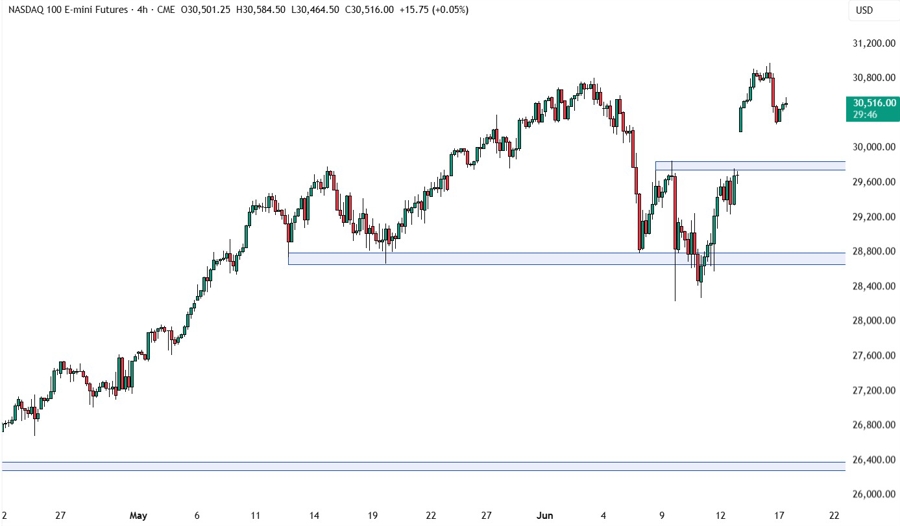
On the 4 hour chart, we can see the market opened the week with a positive gap and rallied into new highs. From a risk management perspective, the buyers will have a better risk to reward setup around the 29,800 support to position for a rally into new record highs. The sellers, on the other hand, will want to see a break to pile in for a drop into the 28,700 level next.
NASDAQ TECHNICAL ANALYSIS – 1 HOUR TIMEFRAME
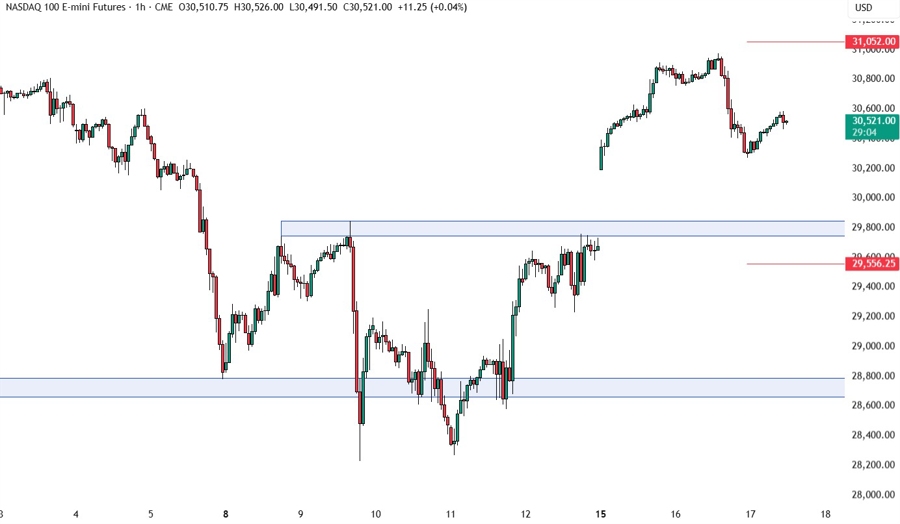
On the 1 hour chart, there’s not much we can add here as the 29,800 support zone provides the best dip-buying opportunity from a risk to reward perspective. Ideally, we see weakness trading into the FOMC decision and then a reversal from the support as the Fed delivers on expectations with no major hawkish surprises. Conversely, hawkish surprises should send the market back to pre-deal levels. The red lines define average daily range for today.
UPCOMING CATALYSTS
Today, we have the FOMC rate decision. Tomorrow, we get the latest US Jobless Claims figures. On Friday, the US-Iran “peace deal” is expected to be signed in Switzerland.


