Share of Micron are trading higher after reaching new all-time highs earlier in the day. Earnings and guidance after the close were stellar. However other once Micron-esque companies are looking tired and old.
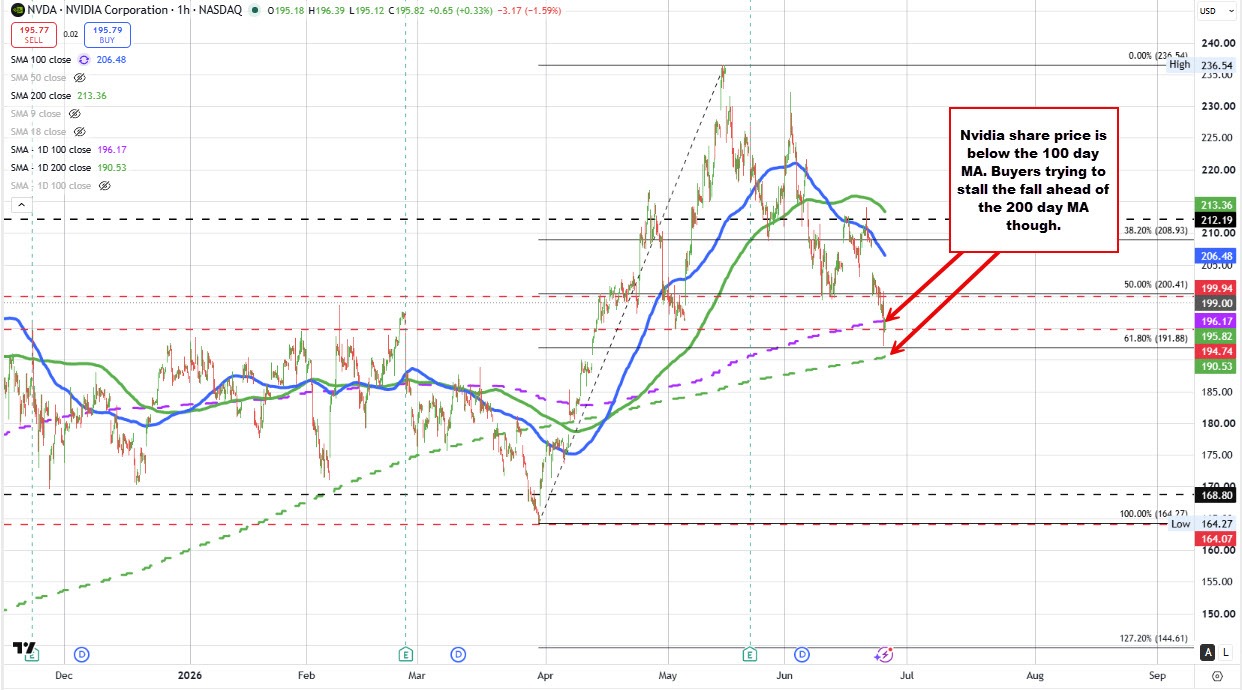
NVIDIA shares are lower on the day and, in the process, have fallen below the 100-day moving average at $196.17. The stock reached a session low of $192.13, but one positive for the bulls is that the price remains above the 200-day moving average at $190.53.
The last time Nvidia traded below both its 100-day and 200-day moving averages was back in early April, when the stock was trading around the $180 area. Since then, buyers regained control and pushed the shares to a record high of $236.54 on May 14, before the recent correction took hold.
From a technical perspective, the area between the 100-day and 200-day moving averages is a key battleground. As long as the price remains above the 200-day moving average, buyers still have a line in the sand to lean against. However, a decisive break below both moving averages would shift the longer-term bias more firmly in favor of the sellers and increase the risk of a deeper correction.
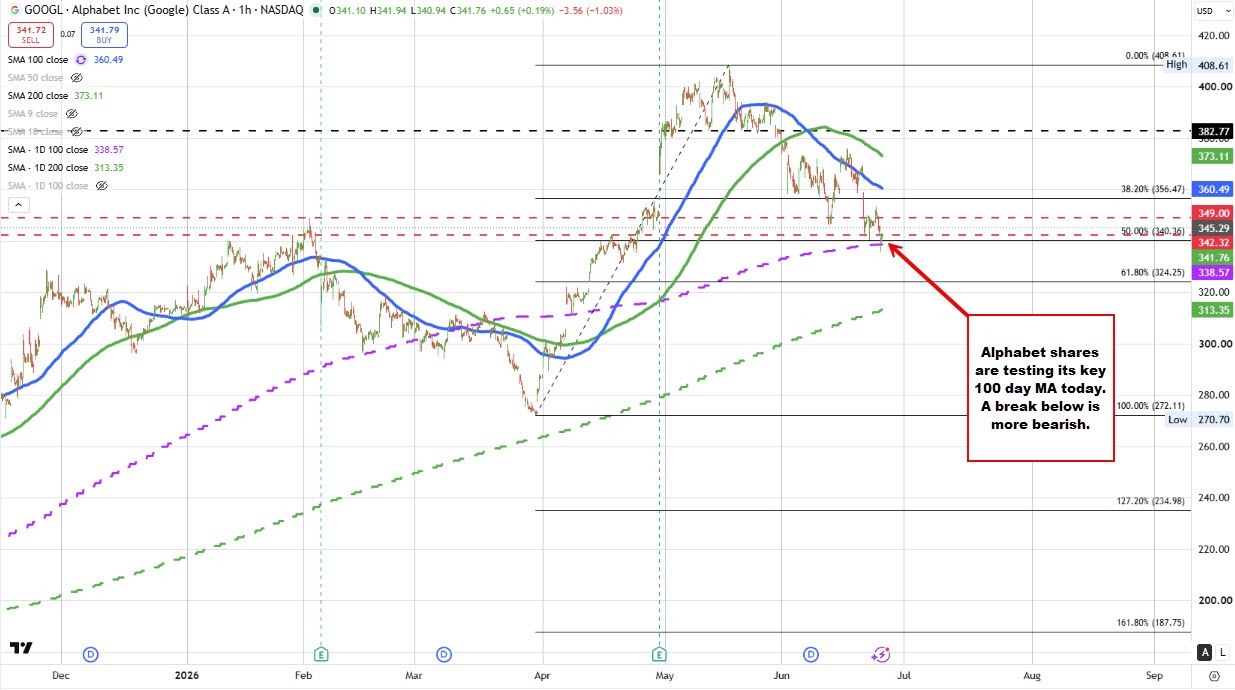
Alphabet shares have moved lower today and in the process dipped below its 100 day MA at $338.57. The low reached $335.84 adn bounced back above the MA, but if broken, would increase the bearish bias for the stock.
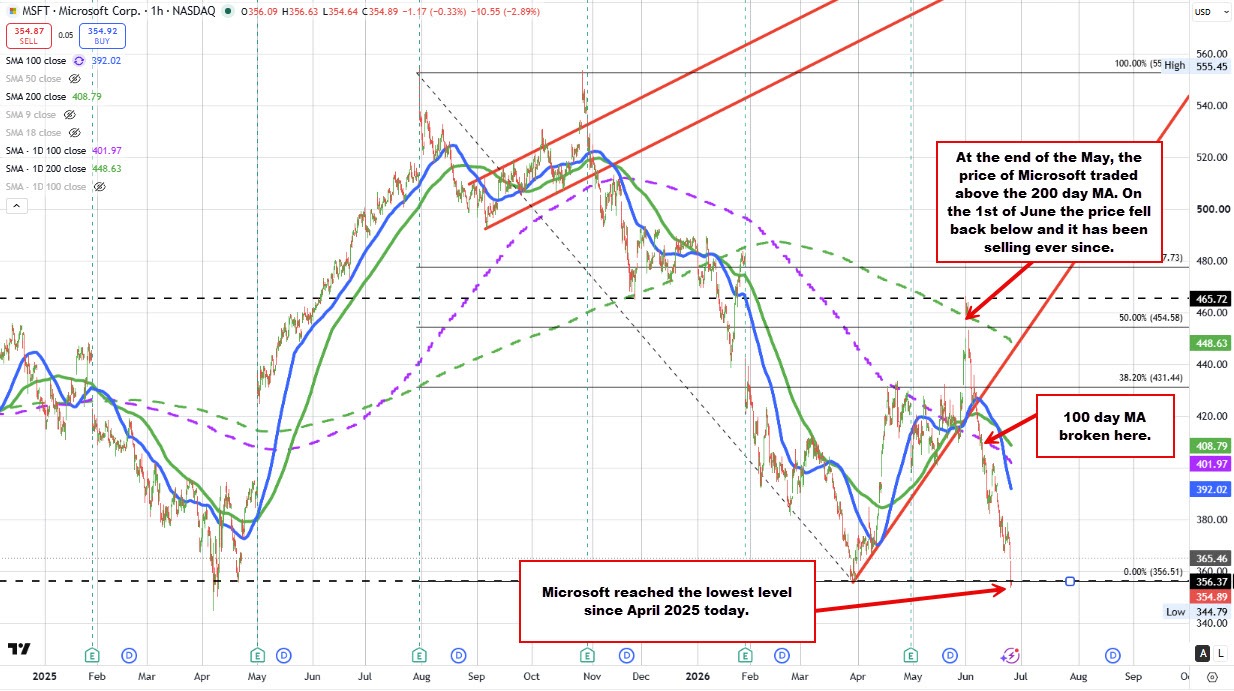
Microsoft shares are under heavy pressure today, falling -2.57% to $356.00 and extending a sharp decline from the May 29 high of $465.72.
That late-May rally briefly pushed the stock back above its 200-day moving average, but the move quickly failed after the shares gapped lower on June 1. Since then, sellers have remained firmly in control.
The technical picture deteriorated further on June 9, when Microsoft broke below its 100-day moving average near $410, accelerating the downside momentum.
Today's low reached $353.68, pushing the stock below its previous 2026 low of $356.51 set in late March. That break has taken Microsoft to its lowest level since April 2025.
For the month, Microsoft is down approximately 23%, highlighting the severity of the recent selloff and keeping the longer-term bias tilted to the downside unless buyers can reclaim key moving-average resistance levels.
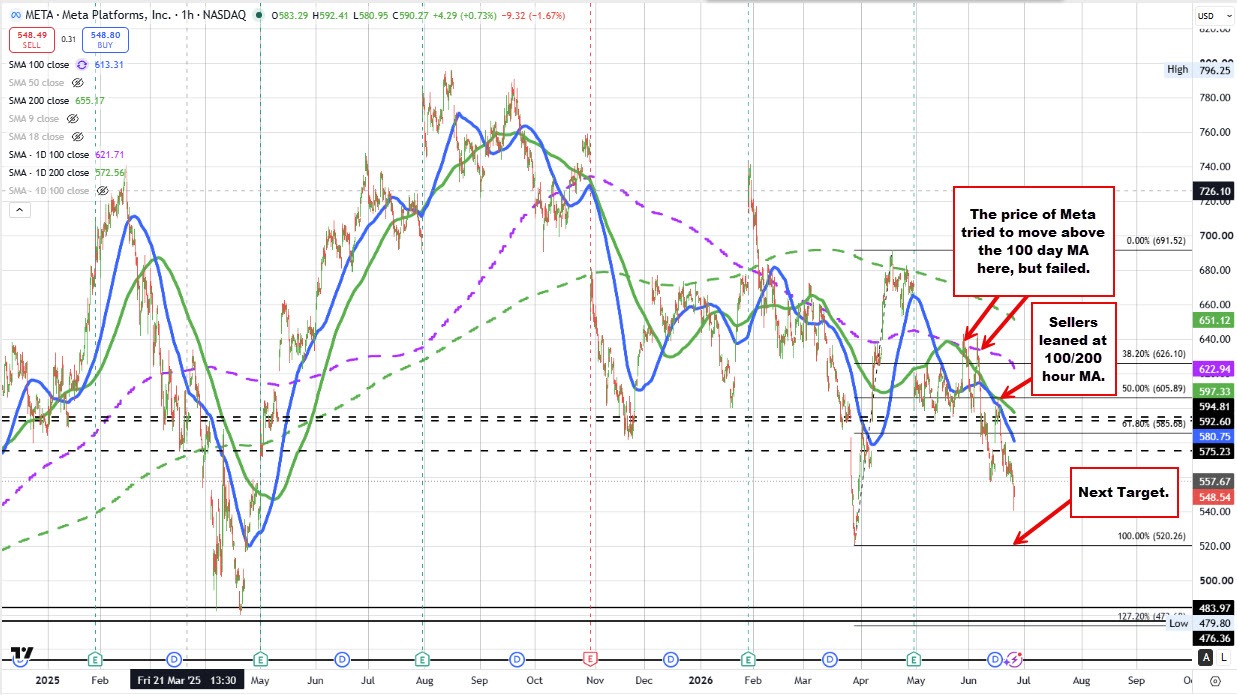
Meta briefly climbed back above its 100-day moving average in late May and early June, but the breakout failed to gain traction.
The stock subsequently fell back below both its 100-day and 200-day moving averages and attempted a corrective rebound on June 16, retesting those key technical levels. However, sellers leaned against the moving averages, defending resistance and reasserting control.
Since that failed retest, the stock has continued to move lower, falling to a new low going back to the end of March. Today's low reached $540.18, which remains above the 2026 low of $520.26, but the technical bias remains firmly bearish.
With the price trading below both major moving averages and sellers controlling the momentum, buyers need to reclaim those levels to shift the near-term outlook back to the upside. Until then, the path of least resistance remains lower.
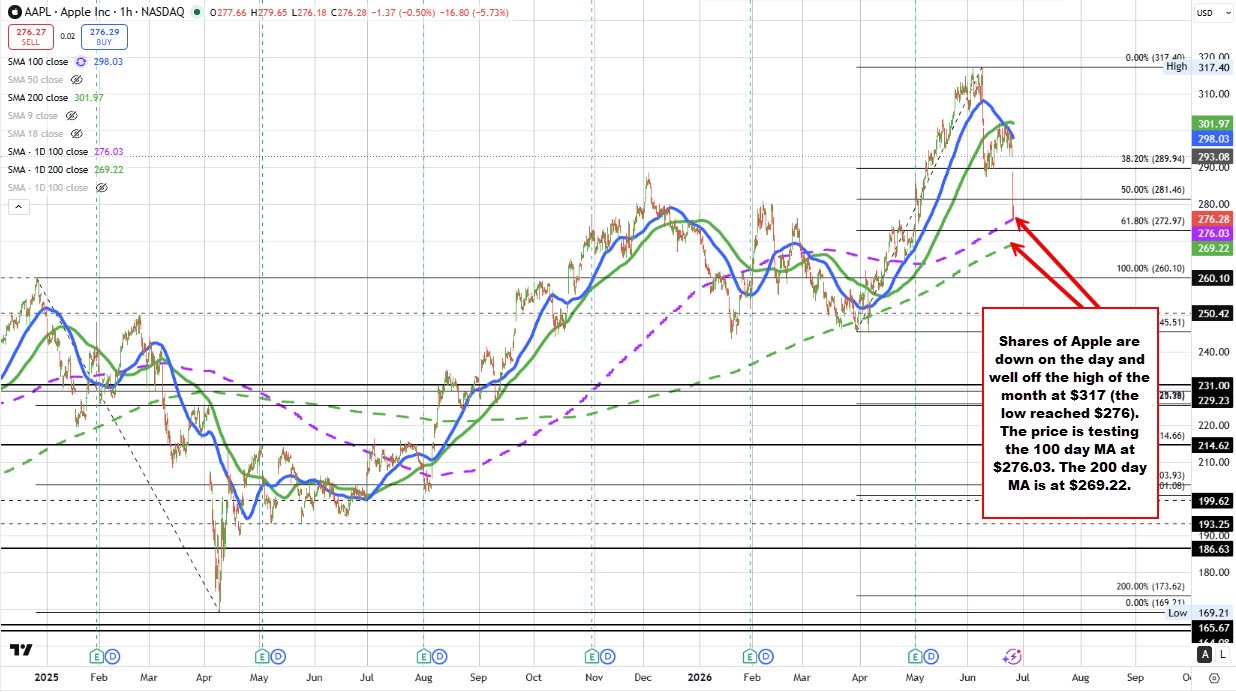
Apple shares have come under pressure after peaking at $317.40 just a few weeks ago. The stock has since retreated sharply, with today's low reaching $276.15, and the price is currently trading near that level.
Importantly, today's decline has brought the stock right down to its 100-day moving average at $276.03, a key technical support level that buyers are trying to defend.
If the price breaks and stays below the 100-day moving average, the next major downside target comes into focus at the 200-day moving average near $269.22. A move below that level would further weaken the longer-term technical outlook and likely invite additional selling pressure.
For now, Apple is at an important inflection point, with the battle centered on whether buyers can hold the 100-day moving average or whether sellers can force a deeper correction toward the 200-day moving average.
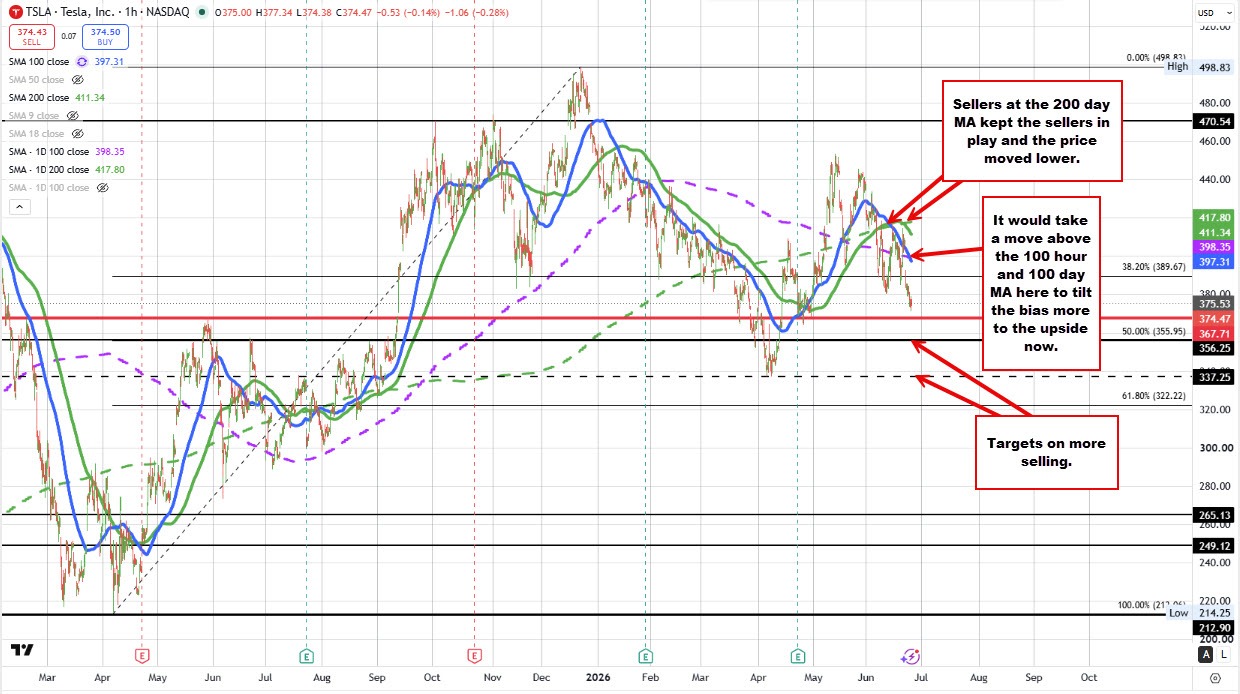
Tesla shares made two attempts to regain momentum, moving above the 100-day moving average on June 12 and again on June 18. However, both rallies stalled before reaching the 200-day moving average, currently at $417.80, signaling that buyers lacked the conviction to extend the rebound.
Since June 22, the stock has reversed sharply lower, falling to a low of $371.22 today. In the process, the price has dropped back below its 100-day moving average at $398.00, putting the sellers back in control.
For the technical picture to improve, buyers need to push the stock back above the 100-day moving average and hold it there. Until that happens, the failed breakouts and renewed downside momentum keep the bias tilted toward the sellers