
Nike stock analysis: Is NKE quietly building a long-term bottom after earnings?
Nike stock is showing signs of a constructive long-term repair after its recent post-earnings volatility. The setup is not strong enough to justify chasing rallies, but the chart has improved enough that patient investors may want to watch pullbacks into support. On my scale, the current Nike stock score is +6 / +10, meaning moderately bullish.

Key takeaways for Nike stock investors
Bias: Constructively bullish over the long term, but not a clean “buy at any price” setup.
Best approach: Pullback accumulation looks more attractive than chasing strength.
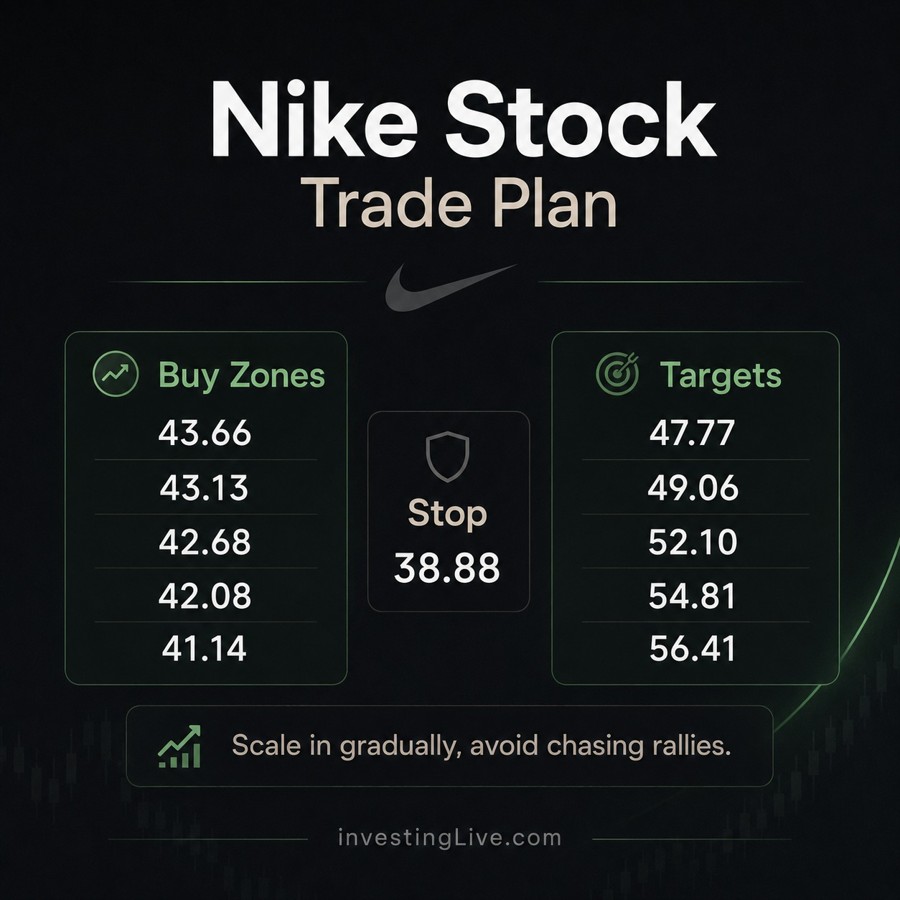
Support to watch: The $41-$43 area is the key zone where buyers need to keep defending price.
First resistance: The $47-$49 area is the first major upside test.
Risk level: A decisive move below $39 would weaken the current recovery thesis.
What does the Nike stock chart show after earnings?
While the bullish sentiment around AI might be seeking a breather as Zuckerberg’s AI agent development has not accelerated as expected over the last four months, and while buyers in the broader U.S. stock indices try to end the shortened July 4 week with a bang, I am currently digging into a different kind of volatility. I have been dissecting the price action for Nike (NKE) following its confusing earnings report. Even though the stock saw a 4.9% move after the earnings announcement, the underlying fundamentals are still struggling.
To put the NKE performance into perspective, I have analyzed the recent data patterns to see how they compare to other high volatility moves.
| Period | AMC Performance | NKE Performance |
| 1 Week Before | -3.1% | -5.2% |
| Day of Earnings | +4.9% | +11.8% |
| 1 Week After | -2.8% | +3.5% |
I was watching the after-market after the NKE earnings. It started postive and went up 6.9% from $41.05 to $43.90, then within an hour crashed a staggering 15.5% to a low of $37.04. The next day (1st day after its earnings) it closed at $43.06. Traders would see that as a confusing roller coaster, and market makers love to sweep and stop hunt everyone in the house.
Nike has spent much of the year trying to repair the damage from a sharp decline. The important change now is that the stock is no longer behaving like a name in freefall.
After the earnings-related flush, buyers stepped in aggressively enough to reclaim the low-$40s and push price back toward the mid-$40s. That type of reaction does not guarantee a new bull market, but it does suggest that selling pressure may be starting to lose control.
For long-term investors, that distinction matters.
A falling stock is not automatically cheap. A strong brand can keep falling for months if institutions are still reducing exposure. The more interesting situation begins when price stops making aggressive new lows, volatility starts to contract, and buyers repeatedly defend the same support area.
Nike appears to be moving into that kind of base-building phase.
Why a long-term bottom usually takes time
Many investors want the perfect bottom, but markets rarely make it easy.
After a large decline, a stock often needs to spend weeks or months rebuilding confidence. This sideways process is called base building.
What this means: A base is a zone where buyers and sellers gradually reach balance after a major decline. It allows weak holders to exit, gives larger investors time to accumulate shares, and reduces the risk of another immediate breakdown.
That is why the current Nike setup should be viewed as a repair, not a confirmed new uptrend. The stock is improving, but it still needs to prove that buyers can defend pullbacks and eventually push through resistance.
Nike support and resistance levels to watch
| Area | Price zone | Why it matters |
|---|---|---|
| Main pullback support | $41-$43 | Key accumulation zone where buyers have recently shown interest |
| Deeper warning zone | Around $40 | A return here would suggest the first repair attempt is weakening |
| Risk / invalidation area | Below $39 | A break below this area would damage the bullish recovery thesis |
| First resistance | $47-$49 | First major zone where investors may see supply or profit-taking |
| Larger recovery zone | $52-$56 | Higher target area if the base develops into a stronger trend reversal |
The most attractive part of this map is not that Nike has bounced. It is that the stock has started to show evidence of support around the same area. Repeated defense of a support zone often comes before a healthier sequence of higher lows and higher highs.
A patient accumulation plan for Nike stock
For investors who are constructive on Nike but do not want to chase the first rally, a staged buying plan can make more sense than buying a full position at once.
One possible framework is to divide the intended position into five smaller pieces and add only if the stock pulls back into support.
| Step | Approximate buy zone | Role in the plan |
|---|---|---|
| First entry | Around $44 | Initial starter position |
| Second entry | Around $43 | Adds if the pullback remains orderly |
| Third entry | Around $42.50 | Main structural pullback area |
| Fourth entry | Around $42 | Deeper support test |
| Final entry | Around $41 | Last planned allocation, only if buyers still defend the zone |
If all levels are reached, the average entry would be near $42.50. Using a risk area below $39, the downside from the average entry would be roughly 8%-9%.
This is not a guarantee that the trade will work. It is a structured way to avoid emotional buying and keep risk defined.
Why scaling into a position can help long-term investors
Scaling into a position means buying in stages instead of committing the full amount immediately.
This can be useful because stocks often retest support more than once before a real recovery begins. If investors buy everything on the first bounce, they may become emotional when the stock pulls back. If they divide the position into smaller purchases, they can act more patiently.
For Nike, this matters because the stock is still below major resistance. The chart is improving, but it has not yet completed a full long-term trend reversal.
Nike upside targets if the recovery continues
If Nike holds the support zone and buyers continue to build acceptance, the first upside zone to watch is $47-$49. That is where the first partial profit or reassessment could make sense for swing investors.
Beyond that, the larger recovery area sits around $52-$56.
| Target area | Practical meaning |
|---|---|
| $47-$49 | First major resistance and possible partial profit zone |
| Around $52 | Larger recovery target if buyers keep control |
| $55-$56 | Extended target if the base turns into a stronger trend reversal |
For long-term investors, taking partial profits is optional. For swing traders or position traders, however, trimming part of the position into resistance can reduce pressure and allow the remaining shares to participate if the recovery continues.
What this means: Partial profit-taking is not about predicting the exact high. It is about reducing risk after the market has already rewarded the first part of the idea.
What would weaken the bullish Nike stock thesis?
The main risk is that Nike’s recent repair turns into another failed bounce.
That would become more likely if price loses the $41-$43 support area and then starts accepting below $40. A decisive break below $39 would be a more serious warning because it would suggest the current accumulation thesis is failing.
The bullish case also depends on broader conditions. Nike remains sensitive to consumer spending, margin trends, brand momentum, future earnings reports, and overall stock market sentiment. A weak market backdrop can pressure even good long-term companies.
That is why this setup should be treated as a scenario, not a certainty.
Nike stock investor scenario map
| Scenario | What needs to happen | What it would suggest |
|---|---|---|
| Bullish repair continues | Nike holds $41-$43 and later pushes above $47-$49 | Buyers are gaining control and a larger recovery toward $52-$56 becomes more realistic |
| Neutral base-building | Nike trades between $41-$49 | The stock is still repairing, but not yet in a confirmed uptrend |
| Bearish failure | Nike loses $41, then breaks below $39 | The base-building thesis weakens and investors should reassess risk |
What should long-term Nike investors watch next?
Nike is no longer acting like a stock in a clean downtrend, but it has not yet proven a full bullish reversal either.
That is the balanced read.
The stock appears to be transitioning from aggressive selling into a potential accumulation phase. For patient investors, the better opportunity may come from pullbacks into the $41-$43 support area rather than chasing strength near resistance.
A sustained move above $47-$49 would strengthen the recovery case. Until then, Nike remains a constructive but still conditional long-term setup.
The key is discipline: define the buy zone, define the risk area, scale gradually if the setup develops, and avoid treating a famous brand name as a reason to ignore the chart.
My read is that NKE is a constructive long-term accumulation candidate, but it should be approached with a defined plan, proper position sizing, and independent research, because this analysis is educational opinion only and every investor remains responsible for their own risk.


