Forex news for New York trading on December 13, 2016
Another record for stocks. Major indices Higher. Dow 20K in sight.
Crude oil futures settle at $52.98
Dow 20,000 getting closer...
US 30 year auction comes in at high yield at 3.152%
Start your engines for the FOMC
Italy leads the way at the European close
Loonie loses out as Canada clears the way for wacky backy use
Forex trading: USDCAD moves closer to some key support targets
Dow homes in on the big 20k
Forex trading: AUDUSD moving above the 0.7500 level
November 2016 US import prices -0.3% vs -0.4% exp m/m
ECB's Constancio isn't coming out from hiding under the covers just yet
The strongest and weakest currencies as NA traders enter for the day
In other markets:
S&P index +14.76 points or 0.65%
NASDAQ composite index +51.289 points or 0.95%
Dow industrial average up +114.78 points or 0.58%
2 year notes 1.1615%, +2 basis points
5 -year notes 1.907%, +2 basis points
10 year note 2.471% unchanged
30 year bond 33.130%, -2 basis points
Spot gold $1158,, $-3.67 or -0.32%
Crude oil futures of $52.43,, $-.40 or -0.76%
The NZD was the strongest currency today rising against all the major currencies today. The JPY was the weakest. The changes were very modest though
It is less than 24 hour from the FOMC decision, and the market traded accordingly today. There was some up and down action but most of the pairs did not wander much from the prior day closes. Besides why trade the currencies actively when the Dow and other indices are on the run higher. The Dow got with 50 pips of the magical Dow 20K. Wow.
For currency traders today, the bed has been made and barring some "players" getting scared, or other "players" feeling like they have to be in it to win it - at the end of the year, when managers are typically more risk averse - we should see more of the same action until the 2:00 PM ET bell rings and the headlines come streaming across the screens.
Even then, with the market 100% sure we get the hike, and the dollar already "up there", will we get more dollar bullish action? The devil is often in the details. So traders will be looking for clues in the dot plot (even though many Fed officials say traders should not) and in the comments from the Fed Chair when she holds her Press Conference.
Then again, maybe we ignore all that and see a "buy the rumor/sell the fact" trade. It would not be the first time that happened.
That is why we watch the technical levels. So here is what I see for some of the major pairs.
EURUSD
The EURUSD moved to new week highs and above a ceiling area at the 1.0650 level in trading today. The move higher took the pair above the 200 hour MA at the 1.0662 level and reached a high at 1.0666.. That break failed and when the price moved back below the 1.0650 level, the buyers became sellers. Traders do not like fake breaks and that is what we saw. And
Anyway, that 200 hour was broken on Draghi day last week, and until today, that MA has been leaned against by traders on corrections. Today it was and today that break failed.
If the 200 hour MA is not broken before the Fed (it had its chance today and it failed). that level will be topside resistance to get to and through on any rally tomorrow post FOMC. If it is broken, the 1.0689-98, 1.0739 and 1.0769 (200 bar MA on 4 hour chart) become the next upside targets.
On the downside, the 1.0551-67 area and then 1.0517-21*** (that means it is important) are levels to eye. The 1.0517-21 was home to 3 swing lows going back to April 2015 (Dec 2015 and November 2016 are the other two lows at that level). The lowest price for this year reached 1.0503 on the Monday following the Italian referendum last week PS if you go all the way back to March 2003 (yes 2003), the swing low for that month came in at 1.0499. In 2015, that level was broken on the way to a low of 1.0461 but it was only for one single day (it closed at 1.0493 on March 13th, 2013). So KEY LEVEL around the 1.0500 level, and on break, 1.0460. A move below and it should be open road ahead.
USDJPY
Looking at the weekly chart of the USDJPY, the pair moved above and closed above the 100 week MA last week. That MA comes in at 114.665 this week. The low in trading this week? 114.71. Buyers against that MA perhaps? I think so.
Below that level is 114.44-54. Those levels were swing highs from March 2016. If I could define "bearish below levels for this pair", it would be to get below 114.66 and then 114.44-54 (and stay below).
On a move below that area, and we could see a rotation that takes the pair toward 112.43. That is the 50% midpoint of the move down from the June 2015 high.
On the topside, the 115.60 level is the 61.8% of the move down from the 2015 high That is a level to get above first.....
Looking at the 5 minute chart below, on Monday, that level was broken on its way to a high of 116.11. Note the action at the 115.60 level in the chart below. At first it was resistance, then it became support and resistance again. That level is important.
The high at 1.0611 is also a key level. Back on August 24, 2015, the swing low on that day reached 116.09. Five months later on January 20th, that low was broken but could only get to 1.05965 before bouncing back higher. Finally it was broken on Feb 8th 2016 and not seen again UNTIL Monday's high. KEY LEVEL to get to and through if this pair is to go higher into the final half of December.
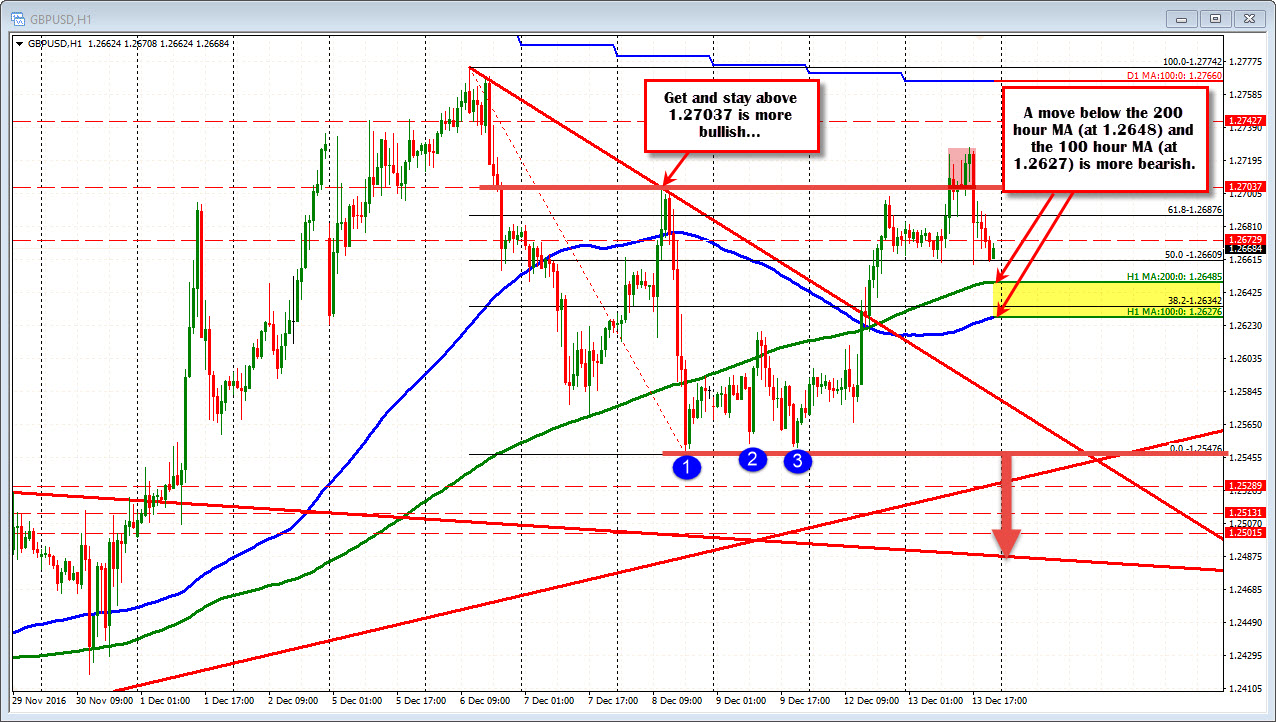
GBPUSD
Looking at the daily chart of the GBPUSD the 100 day MA comes in at 1.2766 today (and moving lower). Earlier this month, the price approached that MA line but found early sellers. The MA remains within shouting distance of the current price at 1.2667 (100 pips). A move higher on the back of the FOMC decision and statement would be more bullish BUT be aware that the low from July at 1.2791 will be another hurdle to ultimately get to and through for more upside potential.
Looking at the hourly chart, the pair moved above the 100 and 200 hour MAs yesterday (see blue and green lines in the chart below). Those MAs are spread apart now at 1.2648 and 1.2627. A move below each - and staying below, should open the door for further downside potential . The low prices last week at 1.2547 and 1.2551 are anther target to get through. Below that 1.2506 is a trend line on the daily chart. Break 1.2500 and there should be further liquidation.
USDCAD
No data out of Canada or the oil complex as well. The price of oil was relatively contained and that was evident in the USDCAD price action. The low to high trading range was only about 36 pips.
If there is a key technical level in the USDCAD on the topside for this pair, it is 100 hour moving average. The price has not traded above that MA since November 28th - 11 trading days ago. The current price is at 1.31337. Not far above that is the 100 day MA at 1.31905. The combination should help to define the limit on the upside - before the FOMC at least.
On the downside for the pair, there is trend line support on the daily chart at 1.3090 and the 200 day MA is at 1.3071 in the new trading day. A move below each is more bearish for the pair but look for patient buyers on the first look at least (with stops below).
AUDUSD
The 0.7500 area (up to 0.7507) has been a ceiling for this pair for the last couple of weeks. ON Tuesday, the price broke above that ceiling and moved to a high or 0.7523. Not far away from that level was the 200 day MA at 0.7530. The sellers pushed the price back below the 0.7500 level into the new trading day. Needless to say, the 0.7500-07 level remains a topside ceiling again followed by the 200 day MA at 0.7530 (after all, they just don't disappear). ON the downside into the new day, the 100 hour MA at 9.7474 (and rising) is key support level #1. The 200 hour MA follows behind that level at the 0.7457 (and rising).
Below are the % changes of the major currencies vs each other.