
FUNDAMENTAL OVERVIEW
USD:
The US dollar has been consolidating against most major currencies since Monday. The US CPI report yesterday came mostly in line with expectations and helped alleviate some of the most hawkish fears. The market pricing hasn’t changed though as traders continue to price in 24 bps of tightening by year-end, down very slightly from 25 bps seen before the CPI release.
As mentioned previously, we can now expect the Fed to drop the easing bias at the upcoming meeting, but the focus will be mostly on the dot plot and forward guidance. Even though a rate hike is now fully priced in, if the Fed endorses the market pricing, it will effectively confirm that the bias has now shifted to tightening and might trigger another rally in the greenback.
The question for markets is now when and how many rate hikes the Fed might deliver by year-end. The US-Iran standoff doesn’t look like it’s going to resolve anytime soon, so that’s going to keep energy prices elevated and force the Fed to act.
AUD:
On the AUD side, the RBA recently softened its tone following the rate hike that pushed the cash rate to 4.35% with one dissenter voting for keeping rates unchanged. The meeting minutes and recent remarks from policymakers indicate that the central bank is leaning toward a pause as they gauge the economic impact of previous hikes.
Those hikes coupled with the negative supply shock are already showing up in the data. Last month, we got a surprise jump in Australia's unemployment rate to 4.5%, the highest level since late 2021, which led traders to scale back expectations of further rate hikes. The recent PMIs showed business activity declining for a third straight month and at the fastest pace in nearly two-and-a-half years, as higher prices and rising interest rates dampened demand.
The market is pricing just a 50% chance of another rate hike by year-end which is unlikely to happen if the Fed turns more hawkish and the US-Iran stalemate extends as that would weigh a lot on global stock markets and business sentiment. I mentioned how this divergence with the Fed was raising the risk of a big selloff in the AUD/USD pair which has now become a reality.
AUDUSD TECHNICAL ANALYSIS – DAILY TIMEFRAME
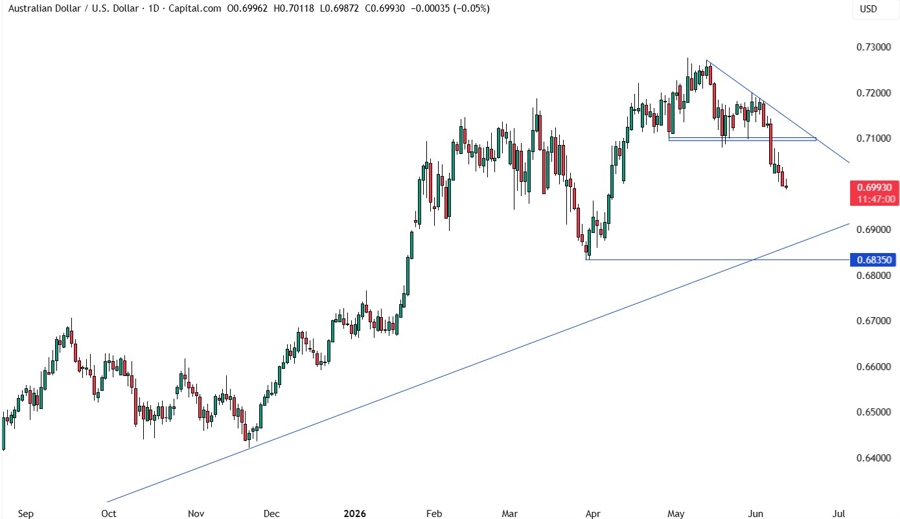
On the daily chart, we can see that AUDUSD eventually broke below the key support zone around the 0.71 handle and extended the drop into new lows. The natural target for the sellers should be the major upward trendline around the 0.69 level. If we get a pullback, the sellers will likely step in around the 0.71 resistance and the downward trendline to target new lows with a better risk to reward setup. The buyers, on the other hand, will want to see the price breaking above the downward trendline to open the door for a rally into new cycle highs.
AUDUSD TECHNICAL ANALYSIS – 4 HOUR TIMEFRAME
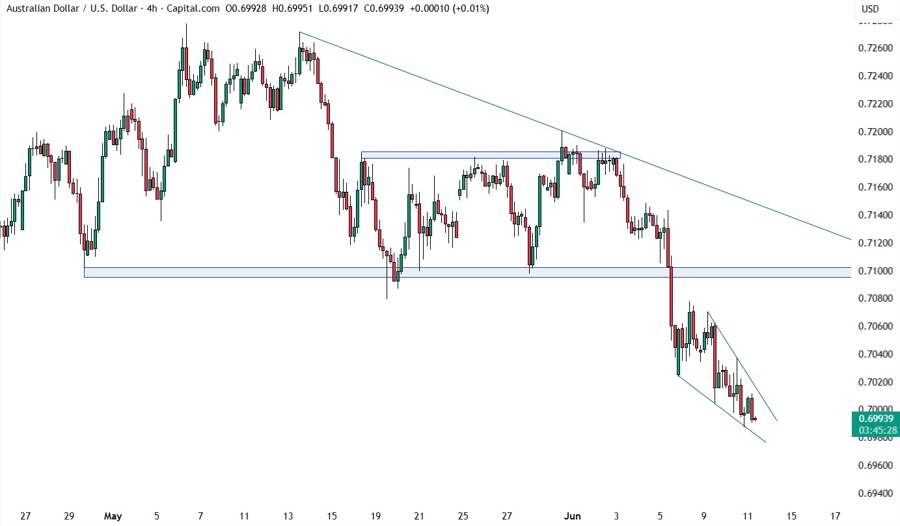
On the 4 hour chart, we can see the recent price action has formed a falling wedge which generally signals weakening momentum and a potential pullback towards the base of the pattern around the 0.7070 level. Such a pullback might not come without a breakthrough in US-Iran negotiations or a less hawkish FOMC decision though. For now, the sellers remain in control and we can expect them to lean on the top trendline to keep pushing into new lows, while the buyers will look for a break to pile in for a pullback into the 0.7070 level next.
AUDUSD TECHNICAL ANALYSIS – 1 HOUR TIMEFRAME
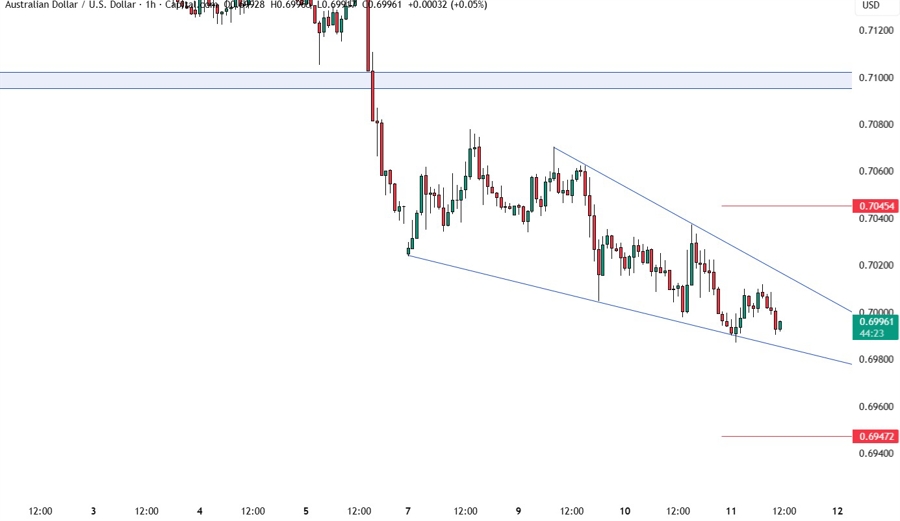
On the 1 hour chart, there’s not much we can add here as the sellers will likely continue to lean on the top trendline with a defined risk above it to keep pushing into new lows, while the buyers will look for a break to trigger a bigger pullback into the 0.7070 level next. A break below the bottom trendline would result in a failed wedge pattern and that’s generally followed by a strong move to the downside. The red lines define average daily range for today.
UPCOMING CATALYSTS
Today, we get the latest US Jobless Claims figures and the US PPI report. Tomorrow, we conclude the week with the University of Michigan consumer sentiment survey.


