
FUNDAMENTAL OVERVIEW
Silver extended the pullback into the major downward trendline following the US NFP report. The data wasn’t bad, but it was enough to trigger a slightly dovish repricing in interest rate expectations. The chances for a July hike are now standing at just 24%, while the probabilities for a move in September dropped to 55%.
As mentioned previously, given the Fed’s focus on inflation, the US CPI will likely be more important. For now, silver will likely remain rangebound at a higher level until we get to the main event.
This week, we don’t have much on the agenda. We have Fed’s Waller speaking today, but unless he explicitly endorses rate hikes, the price action should remain rangebound. The other potential catalyst could be the FOMC meeting minutes on Wednesday.
This is almost never a market moving report but given the limited forward guidance from Fed Chair Warsh, traders will want to see if there’s any further signal in the minutes on the next policy move.
SILVER TECHNICAL ANALYSIS – DAILY TIMEFRAME
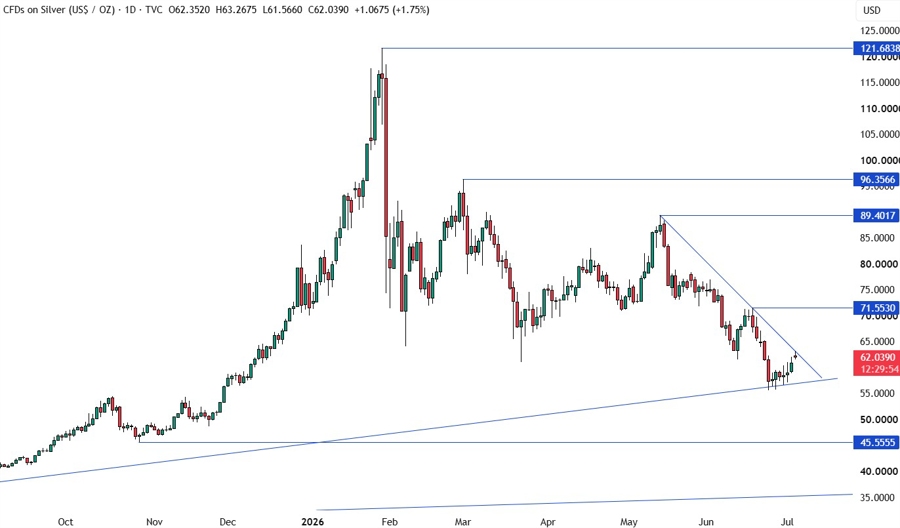
On the daily chart, we can see that silver pulled all the way back to the major downward trendline. This is where we can expect the sellers to step in with a defined risk above the trendline to position for a drop into new lows. The buyers, on the other hand, will want to see the price breaking higher to increase the bullish bets into the 71.55 level next.
SILVER TECHNICAL ANALYSIS – 4 HOUR TIMEFRAME
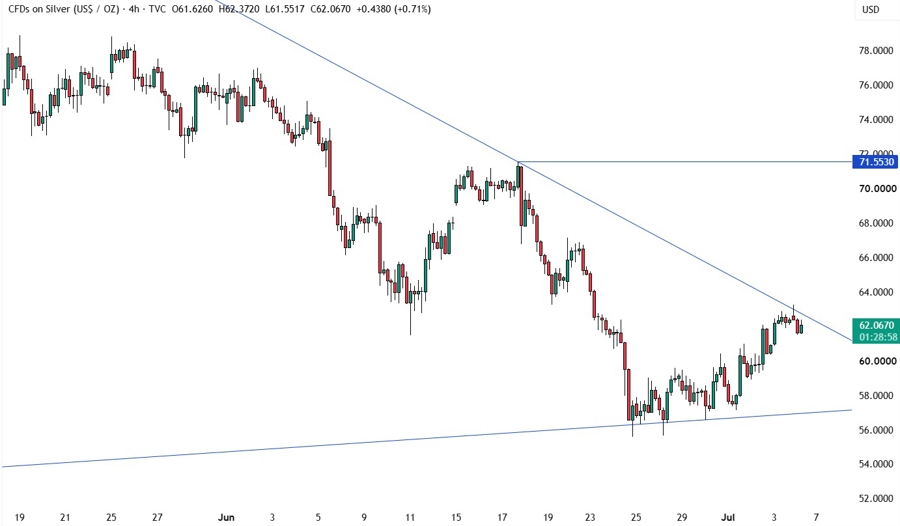
On the 4 hour chart, we can see more clearly the pullback into the trendline and the almost perfect rejection as the sellers started to pile in. There’s not much we can glean from this timeframe, so we need to zoom in to see some more details.
SILVER TECHNICAL ANALYSIS – 1 HOUR TIMEFRAME
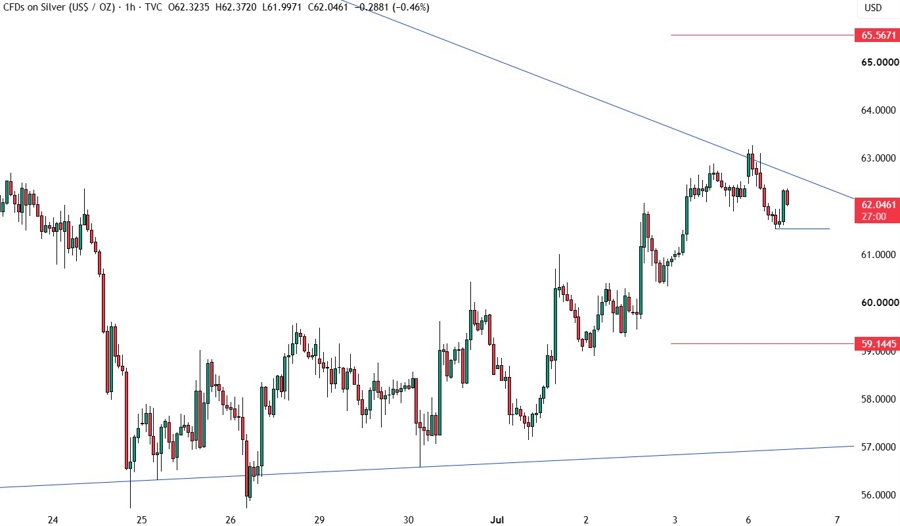
On the 1 hour chart, we can see the first move lower from the trendline created a lower low. If the price breaks through the lower low, we can expect the sellers to increase the bearish bets into new lows with a defined risk above the trendline. The buyers, on the other hand, will have to wait for a break above the trendline to gain more conviction for higher highs. The red lines define the average daily range for today.
UPCOMING CATALYSTS
Today, we get the US ISM Services PMI. On Wednesday, we have the FOMC meeting minutes. On Thursday, we get the latest US Jobless Claims figures.