
FUNDAMENTAL OVERVIEW
Oil prices have briefly fallen below pre-war levels last week but eventually settled above the key 68.00 support zone.
The big unwinding should have run its course now and we could see a prolonged consolidation around these levels. The situation in the Strait of Hormuz is still murky but overall, there’s no real breakdown for now.
The next bearish driver could be the Fed if the US data increases tightening risk. Next week, we get the US CPI report and that could be a major catalyst. If we see an easing in inflationary pressures, it could translate into a more dovish view on the Fed and keep the downside in oil prices more limited on positive risk sentiment and demand outlook.
Conversely, an upside surprise in the data will likely trigger another hawkish repricing in interest rate expectations and put some more pressure on oil prices.
CRUDE OIL TECHNICAL ANALYSIS – DAILY TIMEFRAME
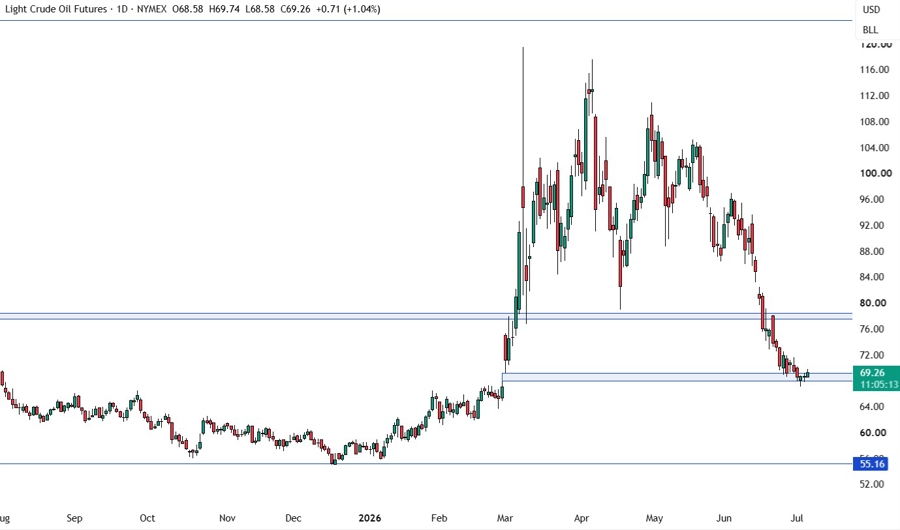
On the daily chart, we can see that crude oil fell briefly below the pre-war levels last week but couldn’t extend the breakout. The price action has been mostly rangebound at the 68.00 support zone. The buyers continue to step in with a defined risk below the support to position for a rally into the 78.00 resistance. The sellers, on the other hand, are waiting for a downside breakout to increase the bearish bets into the 55.00 level next.
CRUDE OIL TECHNICAL ANALYSIS – 4 HOUR TIMEFRAME
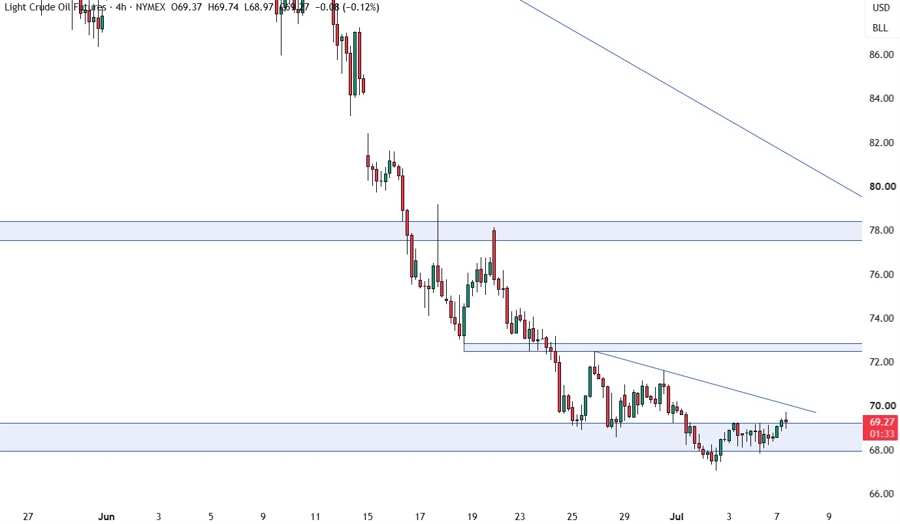
On the 4 hour chart, it looks like the price is bottoming out at the support. We have a minor downward trendline defining the bearish structure. We can expect the sellers to lean on the trendline with a defined risk above it to keep pushing into new lows, while the buyers will look for break to extend the pullback into the 73.00 level next.
CRUDE OIL TECHNICAL ANALYSIS – 1 HOUR TIMEFRAME
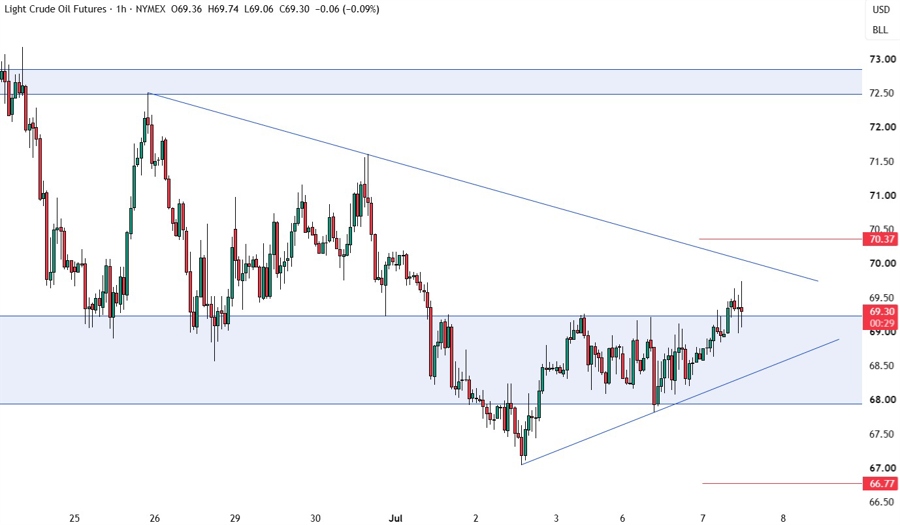
On the 1 hour chart, we have a minor upward trendline defining the current pullback. We can expect the buyers to lean on the trendline with a defined risk below it to keep pushing into new highs, while the sellers will look for a break to pile in for a drop into new lows. The red lines define the average daily range for today.
UPCOMING CATALYSTS
Tomorrow, we have the FOMC meeting minutes. On Thursday, we get the latest US Jobless Claims figures.