
FUNDAMENTAL OVERVIEW
Gold sold off on Friday as the very hot NFP gain with higher revisions for the prior months served as a wake-up call that the Fed could be forced to tighten monetary policy. The job gains have been much higher than the estimated breakeven rate lately. The unemployment rate fell to an unrounded 4.29% vs 4.33% in the prior month.
Following the NFP report, the market fully priced in a rate hike by year-end with the total tightening standing at 30 bps right now. We can now expect the Fed to drop the easing bias at the upcoming meeting, but the focus will be mostly on the dot plot and forward guidance. Even though a rate hike is now fully priced in, if the Fed endorses the market pricing, it will effectively confirm that the bias has now shifted to tightening and might trigger another selloff in gold.
This week, the most important event will be the US CPI report release on Wednesday (barring a surprising breakthrough in US-Iran negotiations). The question for markets is now when and how many rate hikes the Fed might deliver by year-end. Upside surprises would be seen as more hawkish and will likely weigh further on gold prices. Conversely, lower than expected figures should alleviate some of the most hawkish fears and might trigger a relief rally in the short-term.
GOLD TECHNICAL ANALYSIS – DAILY TIMEFRAME
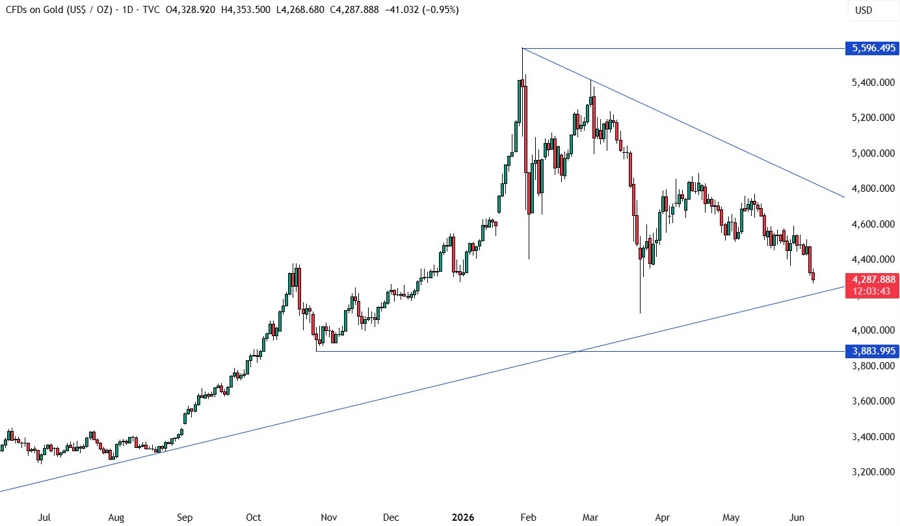
On the daily chart, we can see that gold is approaching the major upward trendline. If the price gets there, we can expect the buyers to lean on the trendline with a defined risk below it to position for a rally into the major downward trendline. The sellers, on the other hand, will want to see the price breaking lower to increase the bearish bets into the 3,885 level next.
GOLD TECHNICAL ANALYSIS – 4 HOUR TIMEFRAME
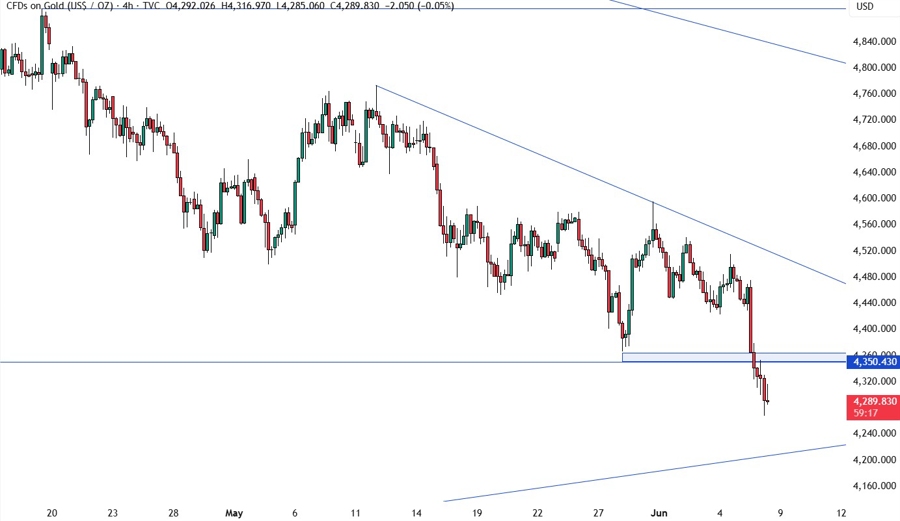
On the 4 hour chart, we can see the price broke below the key 4,350 level following the hot NFP number and extended the drop into new lows. From a risk management perspective, the sellers will have a better risk to reward setup on a retest of the support now turned resistance around the 4,350 level. The buyers, on the other hand, will want to see the price rising back above the resistance to extend the pullback into the minor downward trendline next.
GOLD TECHNICAL ANALYSIS – 1 HOUR TIMEFRAME
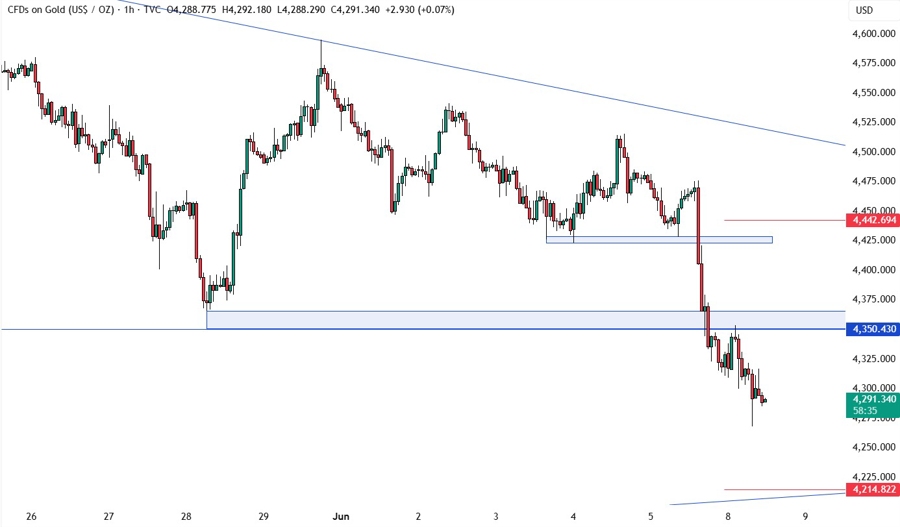
On the 1 hour chart, we can see the NFP triggered a break below the 4,425 support with more sellers piling in to extend the drop into new lows. There’s not much else we can add here as the resistance around the 4,350 level and the major upward trendline remain the key short-term levels. The red lines define the average daily range for today.
UPCOMING CATALYSTS
Today, we have the NY Fed consumer inflation expectations survey. On Wednesday, we have the US CPI report. On Thursday, we get the latest US Jobless Claims figures and the US PPI report. On Friday, we conclude the week with the University of Michigan consumer sentiment survey.


