
FUNDAMENTAL OVERVIEW
Gold has been bouncing around for the entire week on positive and negative US-Iran headlines. Yesterday’s rally came after Trump touted once again on Truth Social that a deal with Iran is in final stages. The gains were eventually faded as nothing of substance has yet been reached.
The negotiating deadlock has been dragging on for a long time and oil prices are likely to remain persistently elevated until the Strait of Hormuz is reopened.
This keeps increasing the risk of a hawkish Fed. More and more policymakers are now pushing for dropping the easing bias, so we can expect that to happen at the upcoming FOMC meeting. Moreover, if nothing changes on the Strait of Hormuz side before then, we might get a hawkish surprise as inflation continues to run hot and the US data remains resilient.
In the short-term, a resolution and the reopening of the Strait will likely support gold on falling oil prices and increased rate cut bets. But if the Strait remains closed for longer and oil prices stay elevated, the risk of the Fed being forced to hike anyway increases, and that’s going to keep weighing on gold.
Today, we have the US NFP report. The focus will likely be on the unemployment rate which is expected to remain unchanged at 4.3%. A drop to 4.2% or lower could trigger another selloff in gold as traders would increase Fed rate hike bets. Conversely, a 4.4% rate or higher might give gold a short-term boost as some of the hawkish expectations get pared back.
GOLD TECHNICAL ANALYSIS – DAILY TIMEFRAME
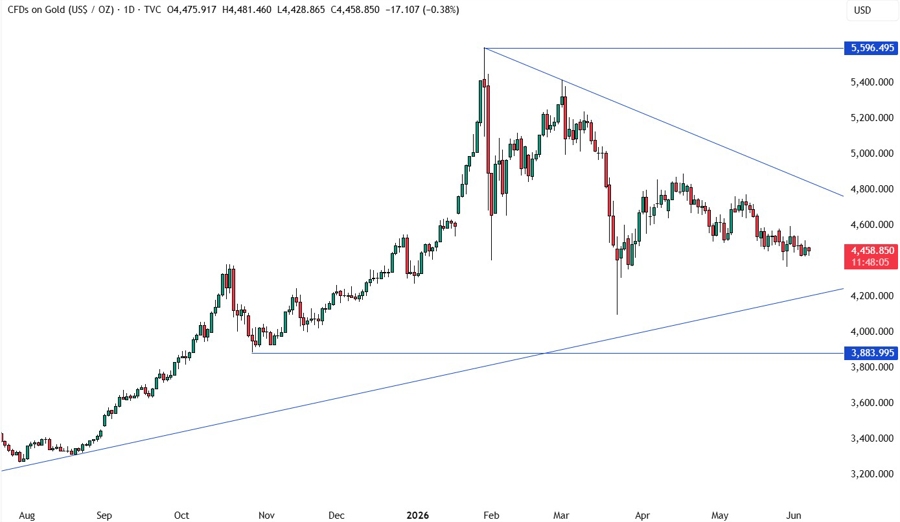
On the daily chart, we can see that gold is still consolidating as traders await new catalysts to push the price into either direction. We are trading right in the middle of the two key trendlines, so there’s not much we can glean from this timeframe. We need to zoom in to see some more details.
GOLD TECHNICAL ANALYSIS – 4 HOUR TIMEFRAME
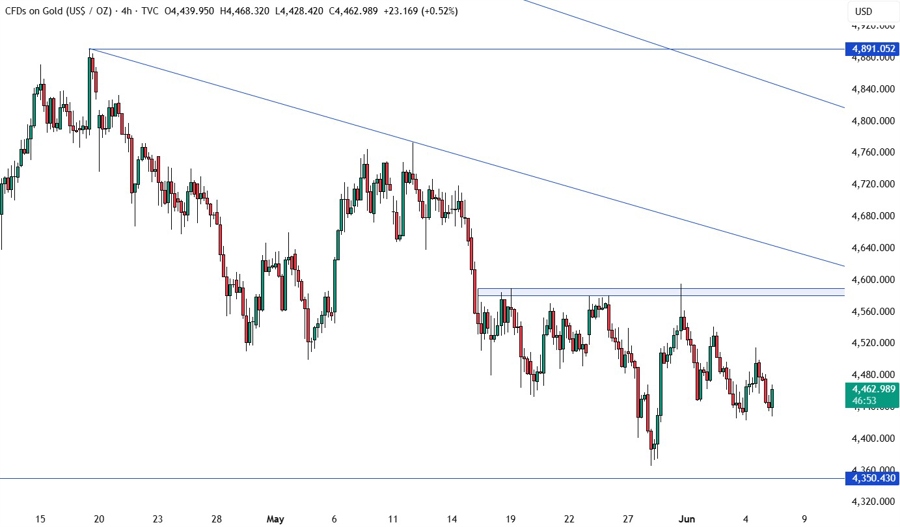
On the 4 hour chart, we have a key resistance zone around the 4,585 level where the price got rejected from several times. From a risk management perspective, the sellers will have a better risk to reward setup around the resistance and the downward trendline to position for a drop into new lows. The buyers, on the other hand, will need the price to break above the trendline to open the door for a rally into the 4,800 level next.
GOLD TECHNICAL ANALYSIS – 1 HOUR TIMEFRAME
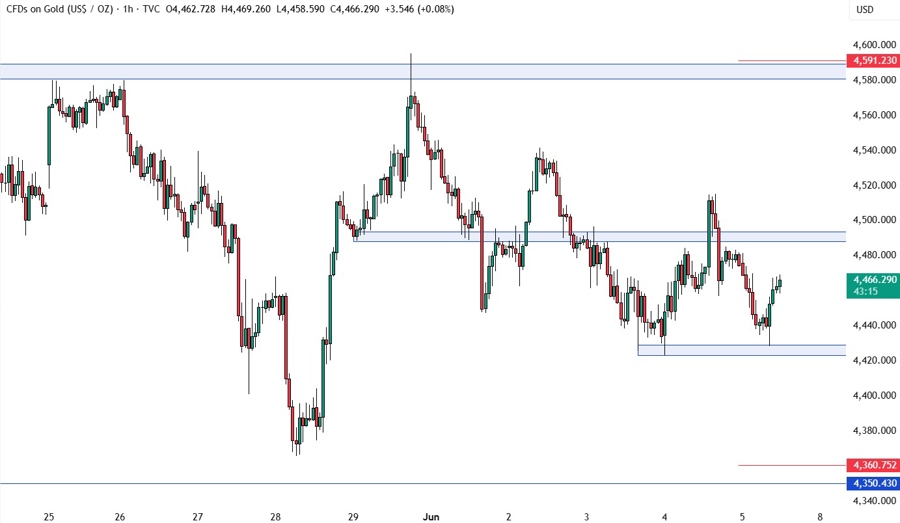
On the 1 hour chart, we have a choppy price action which makes it harder to find good levels where to lean on considering the daily US-Iran noise. For now, we have a clear support zone around the 4,425 level. We can expect the sellers to pile in on the break of the support to target the 4,350 level. The buyers, on the other hand, will want to see the price breaking above the 4,490 resistance to position for a rally into the 4,585 resistance next. The red lines define the average daily range for today.
UPCOMING CATALYSTS
Today, we conclude the week with the US NFP report.


