
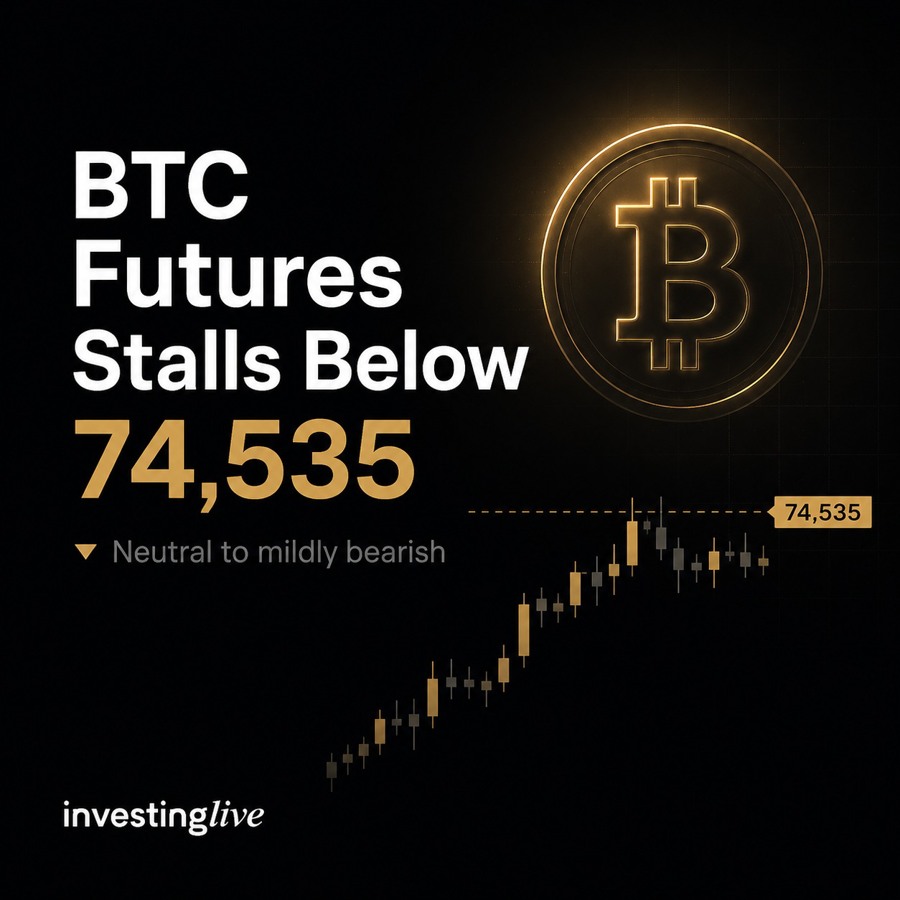
Bitcoin Futures Struggle Below 74,535 as Bullish Repair Attempt Stalls
Last updated: 1 June 2026
Instrument: BTC JUN26 futures
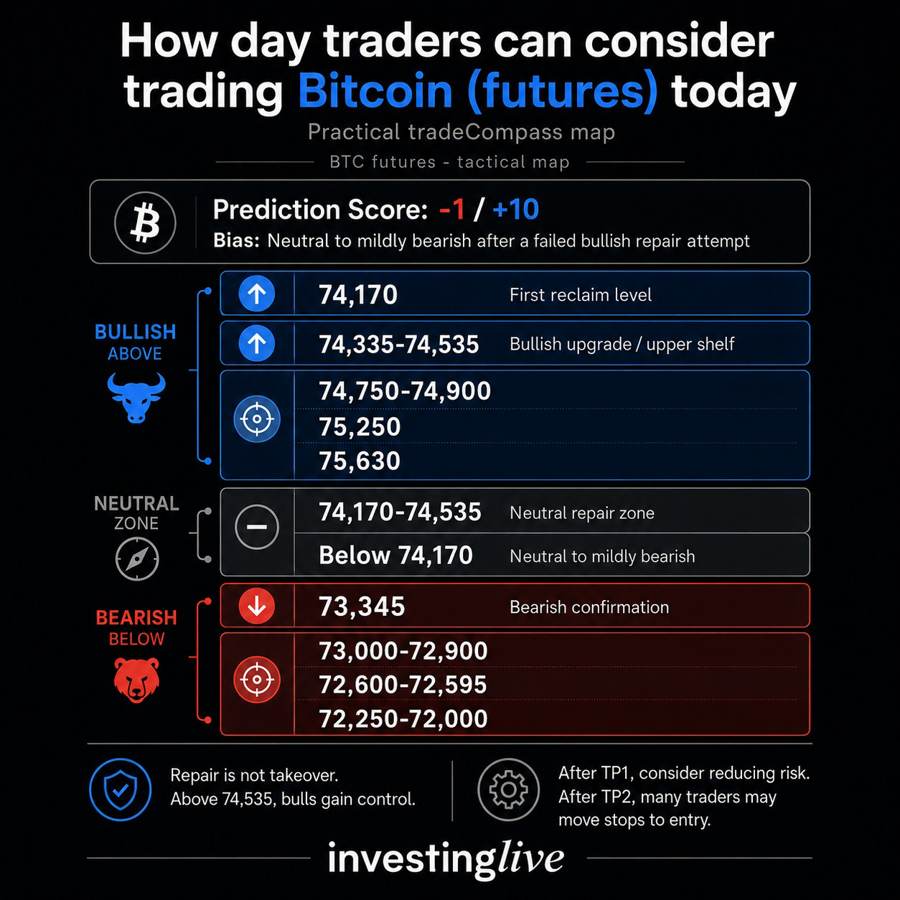
Prediction score: -1 / +10
Bias: Neutral to mildly bearish
Market state: Neutral balance / failed bullish repair attempt inside prior damage
Key takeaways for Bitcoin futures traders
- BTC futures has repaired from the 72,600-72,900 washout zone, but buyers have not confirmed control.
- The main bullish threshold is 74,535. Acceptance above that level would upgrade the structure.
- The first bullish repair level is 74,170, but that alone is not enough to confirm a bullish takeover.
- The cleaner bearish trigger is 73,345. Acceptance below that level would suggest the recent bounce has failed.
- The current tradeCompass score is -1 / +10, meaning the setup is slightly bearish tactically, but not a clean sell-control environment.
Bitcoin futures remain in a neutral-to-mildly bearish tactical state after BTC repaired from the recent washout lows but failed to sustain acceptance above 74,535. Bulls need to reclaim 74,170 first, then prove acceptance above 74,535. Bears get stronger confirmation if price accepts below 73,345.
What is the current Bitcoin futures bias today?
The current BTC futures (JUN26 contract in front) bias is neutral to mildly bearish, with a -1 / +10 prediction score.
That score reflects a market that has repaired from the lows, but has not completed a bullish takeover. In other words, Bitcoin futures are no longer in clean bearish continuation, but the latest order-flow structure still does not justify a bullish reading.
The broader sequence matters. BTC moved from the 77,000-78,000 area into the low 73,000s, and eventually toward the 72,600-72,900 washout zone. That decline created real structural damage, with value migrating lower and several rallies failing to hold.
The important repair came on May 29, when BTC bounced from around 72,595 and rotated higher toward the 74,370-74,535 zone. That was constructive because the market stopped accepting fresh lows and began improving from the lower 73,000s into the high 73,000s and low 74,000s.
But the repair was not clean. BTC pushed toward 74,535, then closed back near 74,035, below the upper value area. Later action also failed to defend the breakout zone.
That is the key point for traders today: buyers repaired the auction, but they have not yet taken control.
What does my simple Bitcoin 4-hour chart below with the regression channel show?
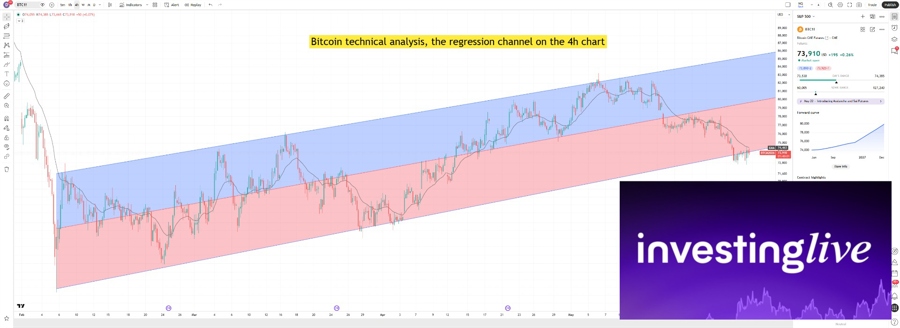
The Bitcoin 4h chart offers a broader technical perspective: price is still sitting near an important decision zone inside a rising regression channel, but the latest pullback means bulls need to repair momentum quickly. This is not yet a clean bullish reversal, but it is also not a confirmed bearish breakdown. The next few four-hour candles may matter more than usual.
A regression channel is not the same as a manually drawn trend channel. A normal channel is usually created by connecting selected highs and lows. That can be useful, but it is also somewhat subjective because the analyst chooses which points matter most.
A regression channel is different. It is built from the full collection of price data over the selected period. The center line reflects the statistical trend of the move, while the outer bands show standard deviation zones around that trend. In this case, the channel uses two standard deviations, meaning it is trying to show where price has generally traded relative to its broader four-hour trend.
That does not mean price must touch the upper or lower rail perfectly. In fact, the chart shows exactly why traders should not treat regression channels as hard walls. Bitcoin has pushed above or below parts of the channel at times. That is normal. The value of the tool is not that every candle respects the boundary perfectly. The value is that it helps traders see whether price is trading in the upper part of its broader trend, the lower part, or slipping into a weaker distribution.
Right now, Bitcoin is near the lower part of that four-hour regression structure after losing the stronger upper-zone behavior seen earlier in the move. That makes this a key junction.
For bulls, the constructive case is that price is still near the lower area of a rising statistical channel, where prior buyers may try to defend the broader uptrend. If Bitcoin can stabilize here and reclaim short-term momentum, this area could become another higher-low attempt inside the broader channel.
For bears, the risk is different. The same structure can also be read as a potential bear flag if price fails to recover, remains trapped below the midline area, and eventually breaks the lower side of the channel with acceptance. In that case, the rising regression channel would stop looking like a healthy trend structure and start looking like a corrective bounce inside a broader bearish phase.
The 20-period EMA on the four-hour chart is also worth watching. A single push above the EMA20 would not be enough by itself, because Bitcoin has recently shown failed repair attempts. However, two consecutive four-hour closes above the EMA20 would improve the probability that bulls are regaining short-term control. That would not guarantee continuation, but it would show that buyers are doing more than producing a temporary bounce.
A practical way to frame it:
| Signal | What it would suggest |
|---|---|
| Two consecutive 4h closes above the EMA20 | Bulls improve short-term momentum and may attempt a higher repair |
| Failure below the EMA20 | Bearish pressure remains active and rallies may still be sold |
| Hold near the lower regression band | Possible higher-low defense inside the broader channel |
| Accepted break below the lower channel area | Bear-flag risk increases and the broader structure weakens |
The main lesson for Bitcoin traders is that a regression channel should be treated as a statistical map, not a rigid prediction tool. It helps identify where price is relative to its recent trend, but traders still need confirmation from candle closes, momentum repair, and acceptance above or below key areas.
For now, the four-hour chart says Bitcoin is at a technical decision point. Bulls still have a path to turn this around, especially if they reclaim the EMA20 with consecutive closes. But if they fail to do so and price starts accepting below the lower regression area, bears may gain a stronger argument that the structure is shifting from bullish repair into a bear-flag breakdown setup.
Why does 74,535 matter for Bitcoin futures?
The 74,335-74,535 area is the latest upper rejection shelf. It is the zone where BTC tried to repair higher but failed to sustain acceptance.
What this means: In auction-market terms, “acceptance” means price does not just briefly trade above a level, but holds there long enough to show that buyers and sellers are willing to conduct business at the new higher price area.
A move above 74,170 would improve the short-term picture, but it would still be a repair signal rather than a takeover signal. The stronger bullish case needs BTC to reclaim and hold above 74,535.
If BTC accepts above 74,535, it would suggest that buyers are absorbing the prior rejection and forcing sellers to defend higher.
What are the key Bitcoin futures levels to watch?
| Zone | Bias | Interpretation |
|---|---|---|
| Above 74,535 | Bullish upgrade | Buyers reclaim the failed upper shelf |
| 74,170-74,535 | Neutral repair zone | BTC improves, but still needs acceptance above resistance |
| Below 74,170 | Neutral to mildly bearish | Failed value-area repair remains active |
| Below 73,345 | Bearish confirmation | Failed bounce risk increases |
| 73,000-72,900 | First lower support | Prior lower balance area |
| 72,600-72,595 | Washout support | Prior repair origin zone |
| Near 75,630 | Larger upside reference | Relevant only after strong bullish acceptance |
What is the bullish scenario for Bitcoin futures?
The first bullish repair level is 74,170. If BTC reclaims that level, the immediate value-area failure begins to repair.
However, a move above 74,170 alone should not be treated as a full bullish confirmation. It would only move BTC back into a more neutral-to-constructive state.
The more important bullish threshold is 74,535.
Bullish trigger
Bullish above: 74,535, only if BTC accepts above it and does not quickly fall back below the rejection shelf.
Bullish targets to consider
| Target | Why it matters |
|---|---|
| 74,750-74,900 | First upside continuation zone after reclaim |
| 75,250 | Next upside reference if buyers sustain control |
| 75,630 | Larger overhead level from the chart context |
The 75,630 area should not be treated as an automatic destination. It becomes more relevant only if BTC first proves acceptance above 74,535.
What is the bearish scenario for Bitcoin futures?
The bearish side becomes more actionable if BTC loses the 73,345-73,380 support zone.
The cleaner downside trigger is 73,345. If BTC accepts below that area and cannot reclaim it, the recent repair likely turns into a failed bounce.
In that scenario, the score could move from -1 toward -3 to -4, because sellers would be forcing price back toward the lower balance area.
Bearish trigger
Bearish below: 73,345, especially if BTC breaks below it, retests it from underneath, and fails to reclaim it.
Bearish targets to consider
| Target | Why it matters |
|---|---|
| 73,000-72,900 | First lower-balance support zone |
| 72,600-72,595 | Recent washout zone where the prior repair began |
| 72,250-72,000 | Extended downside zone if selling expands |
The first downside target is intentionally placed around the prior lower-balance area rather than a random round number. The 72,600-72,595 area matters because that is where the previous repair attempt began.
Why is the Bitcoin futures score only -1?
The score is only -1 / +10 because the market is mixed.
It is not more bullish because BTC failed above 74,300-74,500, then closed below the latest value area. The corrected order-flow picture also shows internal weakness rather than clean buyer control.
It is not more bearish because BTC did repair from the lows. Price is not making fresh lows, value is no longer migrating lower aggressively, and sellers have not yet forced renewed acceptance below the 73,300-73,000 support region.
That combination supports a slightly bearish tactical read, but not a clean bearish-control signal.
What many Bitcoin traders may get wrong today
The main mistake would be treating the bounce from 72,600-72,900 as a confirmed bullish reversal too early.
Yes, BTC repaired from the lows. But repair is not the same as takeover.
A bullish takeover would require price to reclaim the upper rejection shelf and hold above it. For now, BTC has repaired, tested higher, and failed to sustain above the key resistance area.
The better question is not, “Did Bitcoin bounce?”
The better question is: Can Bitcoin accept above 74,535 after failing there?
Until that happens, the bounce remains vulnerable to a retest of lower balance support.
How can day traders use this Bitcoin futures tradeCompass?
For bulls, the first step is a reclaim of 74,170. The stronger long scenario requires acceptance above 74,535. Without that, BTC remains vulnerable to another lower-balance test.
For bears, the cleaner confirmation is below 73,345. A break below that level would suggest the recent repair has failed and could reopen a move toward 73,000-72,900, then 72,600-72,595.
After TP1 is reached, and certainly after TP2, traders can consider moving the stop to entry or reducing risk aggressively. From there, a runner can be left to work, but the trade should no longer be allowed to turn into a full loss if price reverses sharply.
This tradeCompass is a decision map, not a guarantee. Trade Bitcoin futures at your own risk only. The above is for educational purposes only. Visit https://investinglive.com/Cryptocurrency for more on Crypto
Quick FAQ for crypto traders today
- What is the Bitcoin futures bias today?
Bitcoin futures are neutral to mildly bearish while BTC remains below 74,170 and especially below the 74,535 rejection shelf. - What level would turn Bitcoin futures bullish?
A bullish upgrade requires BTC to reclaim 74,170 first and then accept above 74,535. - What is the bearish trigger for Bitcoin futures?
The cleaner bearish trigger is acceptance below 73,345, which would suggest the recent repair attempt has failed. - Why is the Bitcoin futures score -1 / +10?
The score is slightly bearish because BTC failed above 74,300-74,500, but it is not more bearish because price has repaired from the 72,600-72,900 washout zone.


