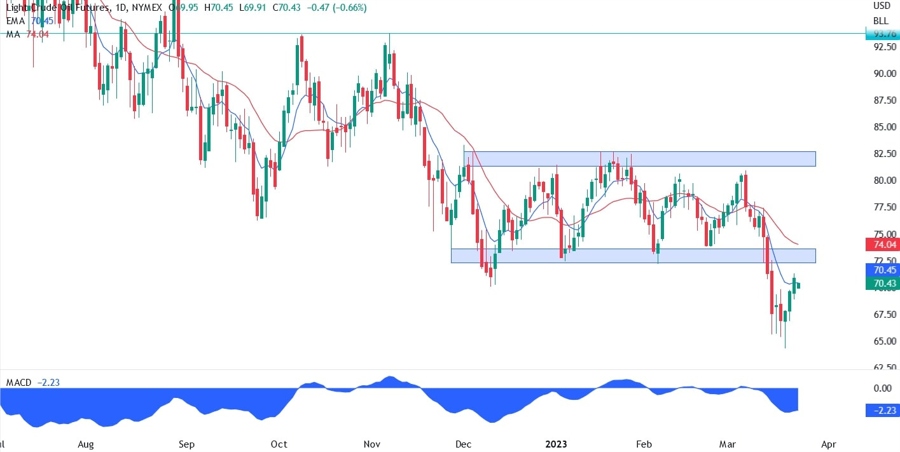
On the daily chart below, we can see that after breaking out of the 3-month-old range, the XTI/USD sellers extended the selloff before finding buyers at the $65 level. The price is now approaching the old support than now should turn into resistance, and we may see a classic “break and retest” pattern which implies that another selloff may come soon.
The recent selloff was caused by the fears of another banking crisis that could tip the economy into a deep recession. These fears may have receded as central banks took emergency actions to calm the markets, but we may see secondary effects in the real economy via tighter financial conditions which would slow activity and demand even more and lead to lower oil prices.
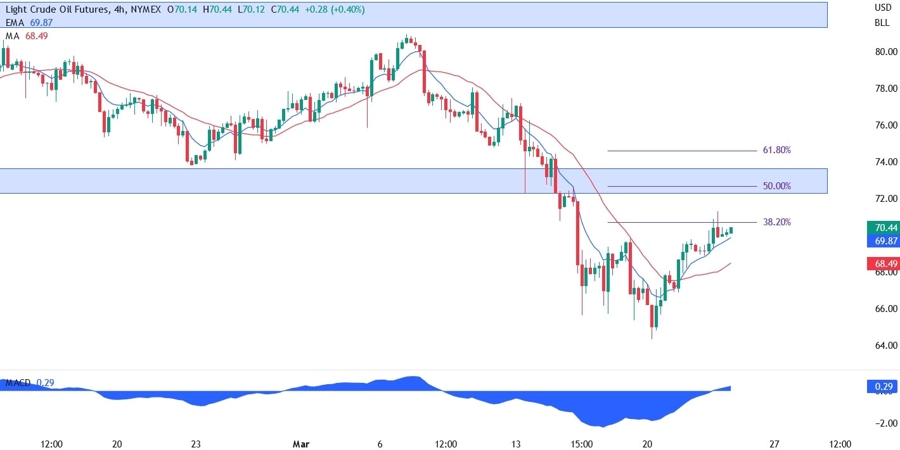
On the 4 hour chart below, we can see that the moving averages are now crossed to the upside as we have a short term uptrend. The resistance zone for the sellers will be between the $72 level and the 50% Fibonacci retracement level. That’s also where the daily red long period moving average will be offering resistance.
During these 3 months the 4 hour moving averages were quite reliable in signalling a change in trend, so the conservative sellers may want to wait until they cross again to the downside before taking new positions.
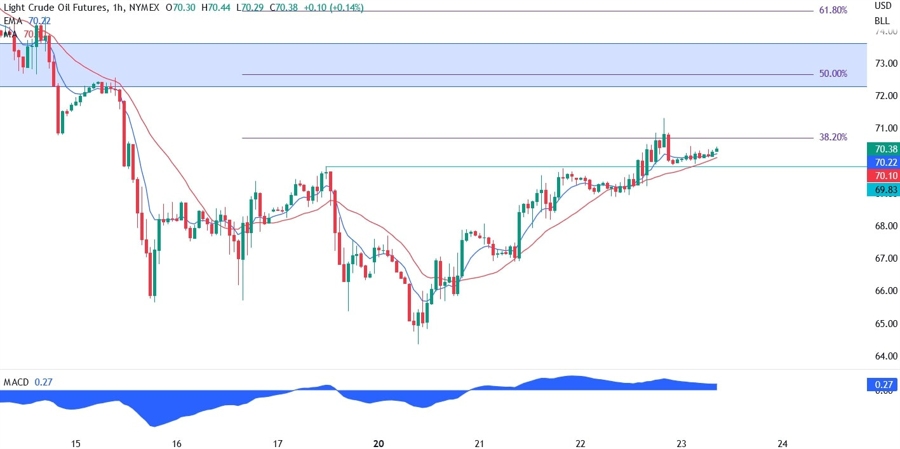
On the 1 hour chart below, we can see that in case the price couldn’t reach the resistance and the market turns before that, the level to watch would be the support at $69.83. If the price breaks below that and the moving averages turn south, then the sellers may start to pile in.
The buyers, on the other hand, should use this support to target the resistance zone at $72. They will need a clear break above the $72 resistance supported by some fundamental catalyst to start another rally towards the previous range top at $82.