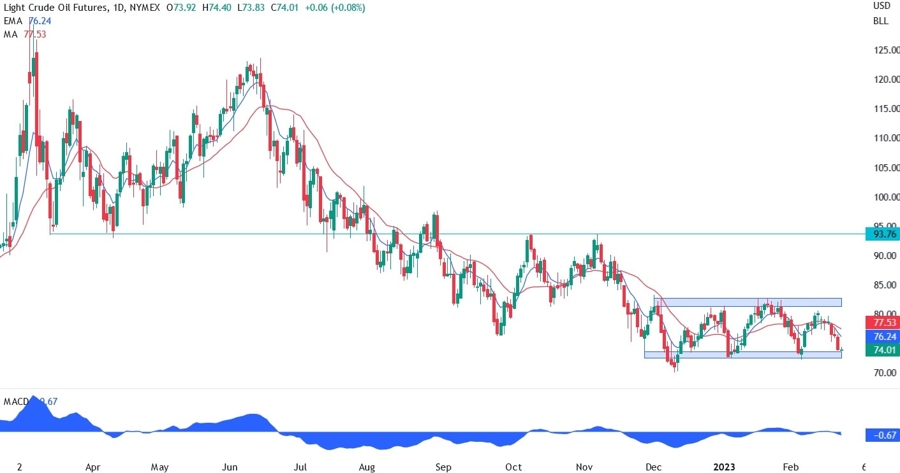
On the daily chart below, we can see that the price has fallen back to the bottom of the range that’s been going on for 3 months now. The market is divided between those that see demand outstripping supply with China reopening and supply disruptions from geopolitical conflicts, and those that see demand falling as a global recession unfolds due to the central banks tightening.
We can see that the low was near the $70 level as that was the price at which the US said they will start to refill their Strategic Petroleum Reserve (SPR). The levels are clear: get above 82.00 and the buyers will start to target the 93.00 level, on the other hand, get below 72.00 and the sellers will look for prices in the $60 region.
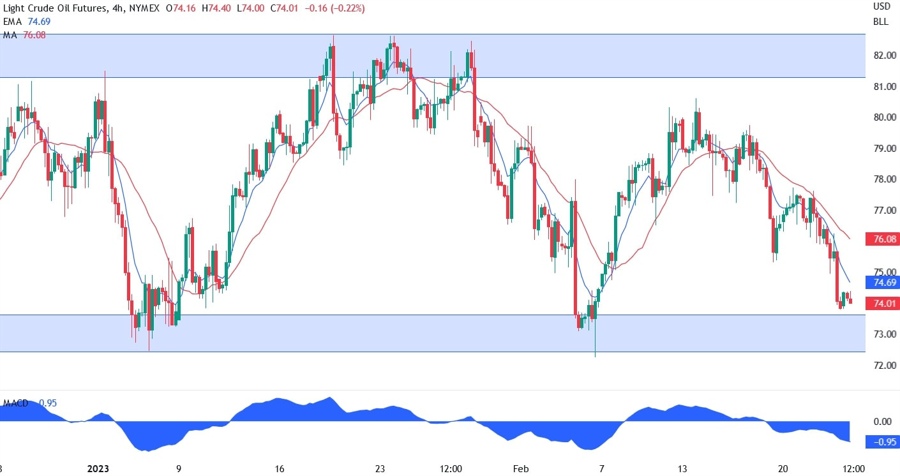
On the 4 hour chart below, we can see more closely the rangebound price action. Recently, Russia has signalled that it will cut oil production by 500k BPD in March and after some short-term gain, the price couldn’t even get to the top of the range as worries on demand are overshadowing the worries on supply.
The best strategy here is to wait for a clear break on either side before taking positions. Otherwise, one can “play the range” buying at support and selling at resistance with defined risk.
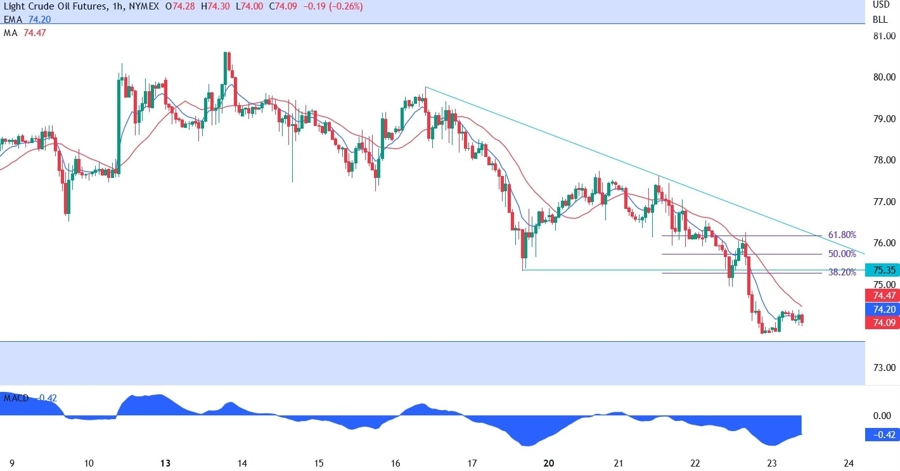
On the 1 hour chart below, we can see that if the sellers want to be aggressive, then they can wait for a pullback into the 75.35 level where we have the previous swing point and the 38.2% Fibonacci retracement level.
This would be a trade in anticipation of a breakout lower from the range and the subsequent fall towards the $60 price area. If the buyers manage to break higher though, the trendline will be the last line of defence before the buyers get even more conviction and start targeting the top of the range again.