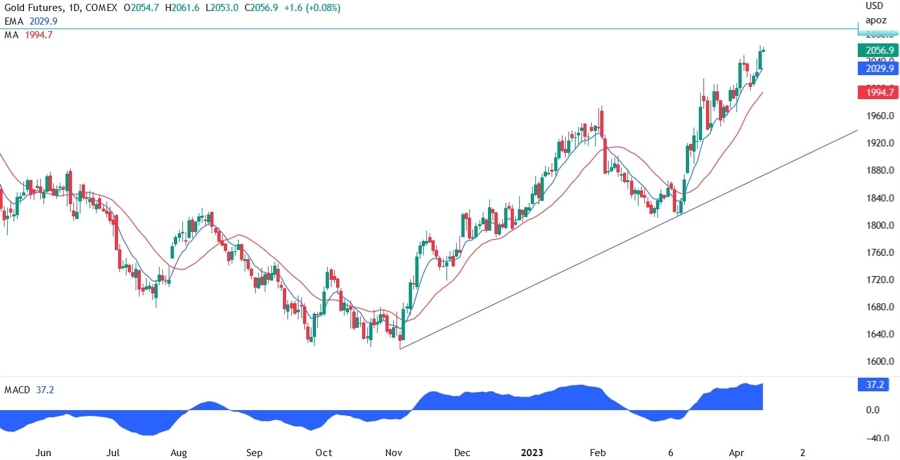
On the daily chart below for XAUUSD, we can see that since the Silicon Valley Bank collapse, gold just kept on surging higher. The reason is pretty simple, gold is inversely correlated with real yields and those have been falling since the banking crisis as the market started to price in rate cuts.
The market is forecasting a recession beginning very soon and it’s likely that the Fed will hike by 25 bps in May and stop there. The moving averages will act as support for the bullish trend so the buyers will lean on them in case of pullbacks.
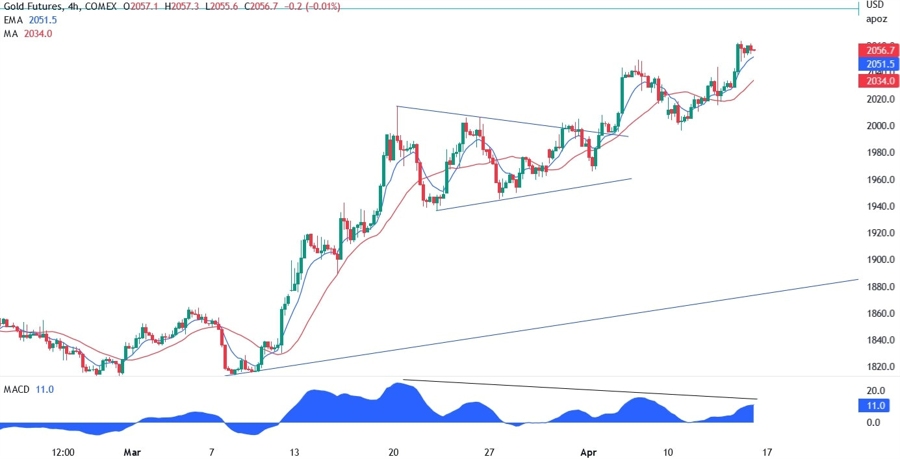
On the 4 hour chart below, we can see that recently gold consolidated a bit around the 2000 level and formed a symmetrical triangle pattern. Once the price broke out, the buyers jumped in and pushed the price to the 2050 level before another pullback into Easter Holidays.
Yesterday, the US Jobless Claims and PPI data missed expectations and gave gold another tailwind to push to higher highs. The price now is not far off the 2020 high at 2087 but a little sign of caution for the buyers is the divergence between this rally into that resistance and the MACD. It may warrant a bigger pullback on the horizon.
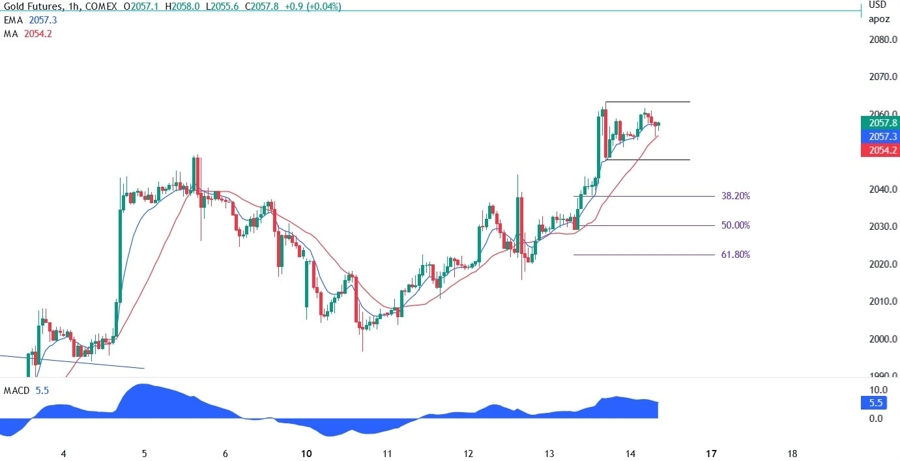
On the 1 hour chart below, we can see that at the moment there’s a little consolidation ahead of the US Retail Sales data today. The buyers will want a break of the high to push the price to the 2020 high, while the sellers will want to see the price breaking lower to take advantage of the pullback, which may find support at the 38.2% Fibonacci retracement level.