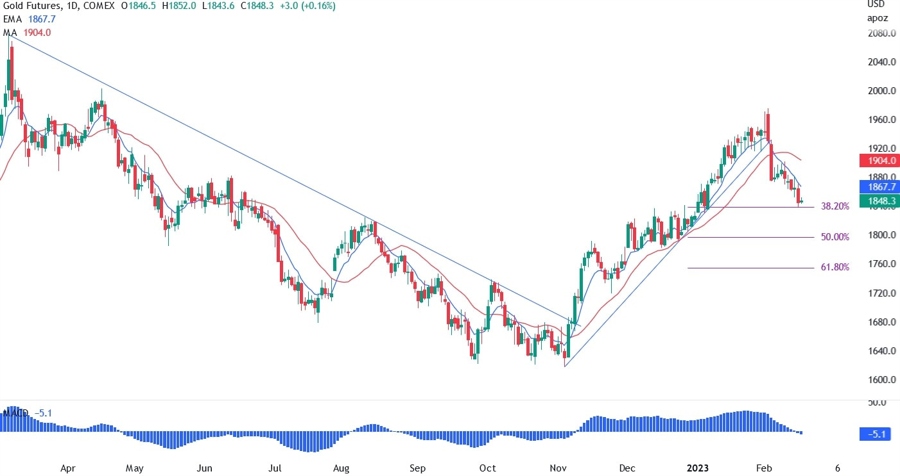
On the daily chart below, we can see how the recent repricing in interest rates expectations led to a sell off in gold. The precious metal is correlated with US real yields so when there’s an expectations of those rising, gold prices generally fall and vice versa in case real yields are expected to fall.
The repricing started when 2 weeks ago the NFP report came out very strongly beating even the most optimistic forecasts. This led the market to think that the Fed may indeed hike to their projected terminal rate and stay there for longer. Then we also had strong ISM Services PMI and Retail Sales reports, and now the market is raising odds of an even higher terminal rate from the Fed.
For the bulls, the price is finding support at 1840 and the 38.2% Fibonacci retracement level. This may be the spot where we may see buyers starting to bid. For the sellers, the moving averages turned south signalling a changing in trend momentum and a bounce may be a good opportunity to look for shorts.
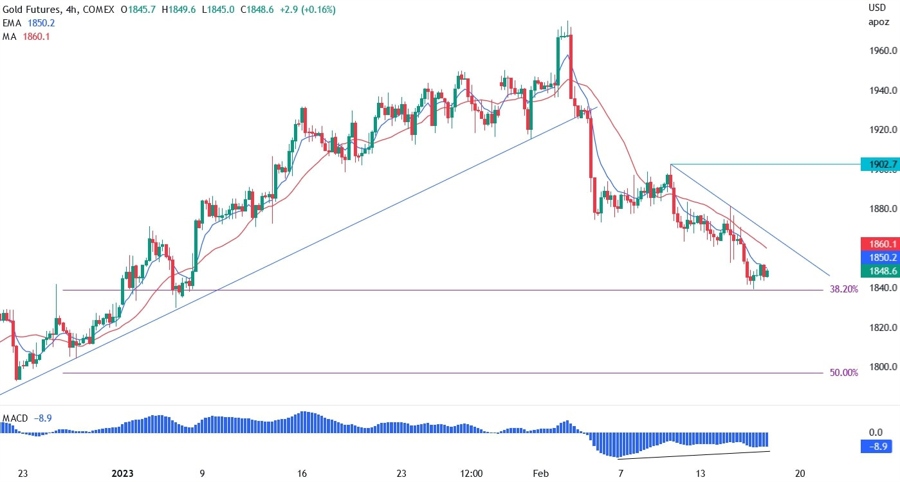
On the 4 hour chart below, we can see that the moving averages are acting as resistance for the lower timeframe trend. There’s a divergence between price and the MACD right at the 38.2% support which should signal an imminent pullback.
We may see the price coming back to the trendline and the resistance zone at 1860 before finding sellers. A break of the trendline to the upside should signal a bigger correction to the 1902 level and that would be the last line of defence for the sellers.
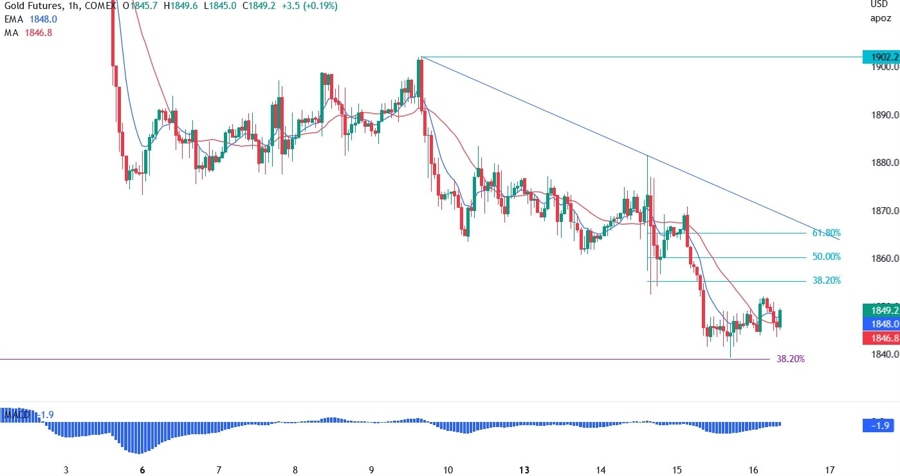
On the 1 hour chart below, we can see the Fibonacci levels on the lower timeframe. A pullback to 50% or 61.8% would be a nice spot for the sellers as there would be confluence with the trendline and the risk would be defined. Again, a break out of the trendline should signal a bigger pullback to the 1902 level.