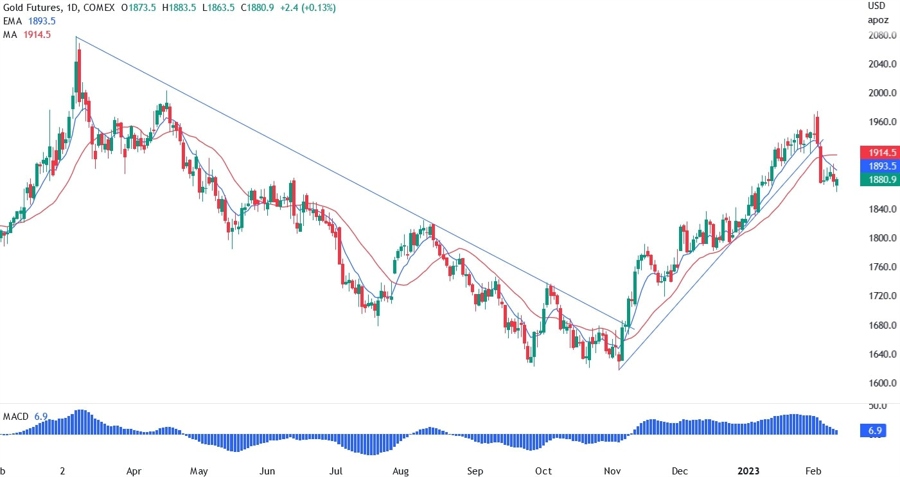
On the daily chart below, we can see how the price of gold has been trending up since the US CPI report in November. The market started to expect a less hawkish Fed and an earlier than expected pause in their tightening cycle.
Of course, after that the market started to see also cuts coming later in 2023. The price of gold is correlated with real yields because treasuries “compete” with gold as risk free assets, but gold doesn’t have a yield and the buyers can profit only from price appreciation.
So, when the real yields are expected to rise you will see the price of gold fall and vice versa.
The repricing we saw in the market expectations out of the NFP report caused real yields to rise and the price of gold fall. If this persists, gold will weaken further. The US CPI report next week will be key for the next move.
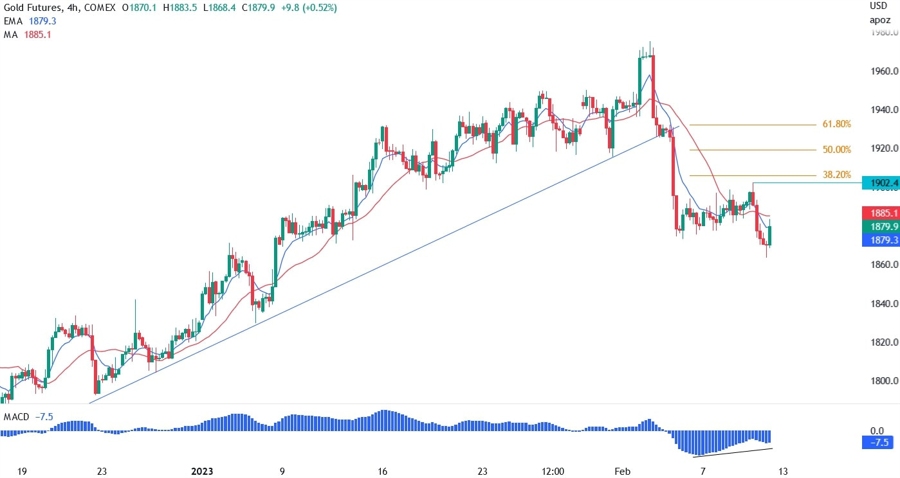
On the 4 hour chart below, we can see that after the sell off out of the NFP report, the price pulled back a bit towards the 38.2% Fibonacci level but fell short of touching it.
Given the divergence between the recent downward move and the MACD, it may be a fake move and we may see a fade toward the 38.2% level again. This may be also supported by the market waiting for the US CPI report next week and sellers taking off risk in case the data miss expectations.
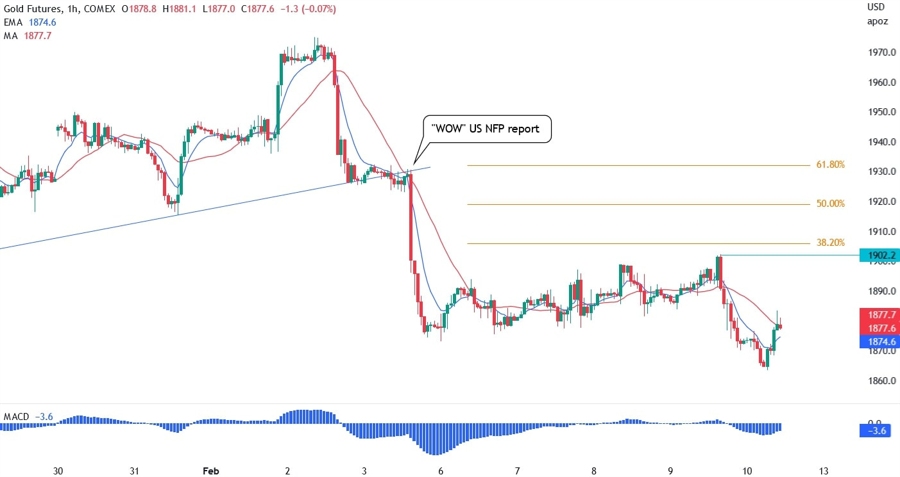
On the 1 hour chart below, we can see more clearly how the NFP data triggered the sell off in gold. From a risk management perspective, it would be better for the sellers to wait for the price to come back to the recent high at 1902 acting as resistance and the 38.2% Fibonacci level before committing to short positions as the US CPI data can make the price move fast on either side.