Crude Oil keeps on surging to new highs as the supply side gets squeezed more amid resilient global demand. In fact, the OPEC continues to forecast robust growth for oil demand in 2023 and 2024 while keeping supplies tight as we saw last week with the Saudi Arabia and Russia extending the voluntary supply cuts. Moreover, Libya shut four of its eastern oil export terminals due to a deadly storm and Kazakhstan reduced daily oil output for maintenance. As long as the economies remain resilient, we might continue to see such high oil prices, which could eventually make the battle against inflation harder.
WTI Crude Oil Technical Analysis – Daily Timeframe
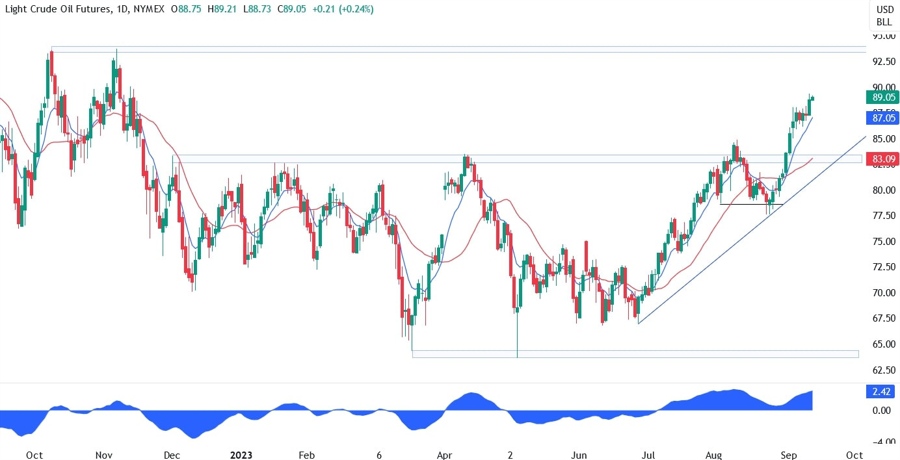
On the daily chart, we can see that after the breakout of the key $83 resistance, Crude Oil just kept on rallying with almost no pullback. The bullish momentum seems to be waning as the price approaches the $90 level, so the risk management now becomes key as the risk of a bigger correction increases. In case of a deeper pullback, the strongest support would be the broken resistance turned support around the $83 level where we can also find the trendline.
That’s where we can expect the buyers to pile in again with a defined risk below the support and target a new higher high. The sellers, on the other hand, will want to see the price breaking through the trendline to invalidate the bullish setup and take the price to the previous lows around the $65 level.
WTI Crude Oil Technical Analysis – 4 hour Timeframe
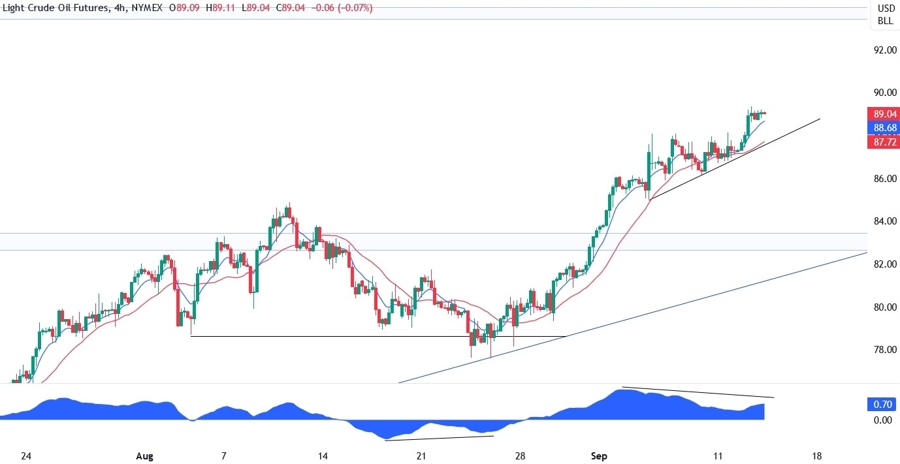
On the 4 hour chart, we can see that the price is diverging with the MACD, which is generally a sign of weakening momentum often followed by pullbacks or reversals. In this case, we might get a pullback into the minor black trendline where we can also find the red 21 moving average for confluence. This is where the buyers are likely to step in with a defined risk below the trendline and target the $93 resistance. If the price breaks through the trendline, the sellers are likely to pile in to extend the fall into the $83 support.
WTI Crude Oil Technical Analysis – 1 hour Timeframe
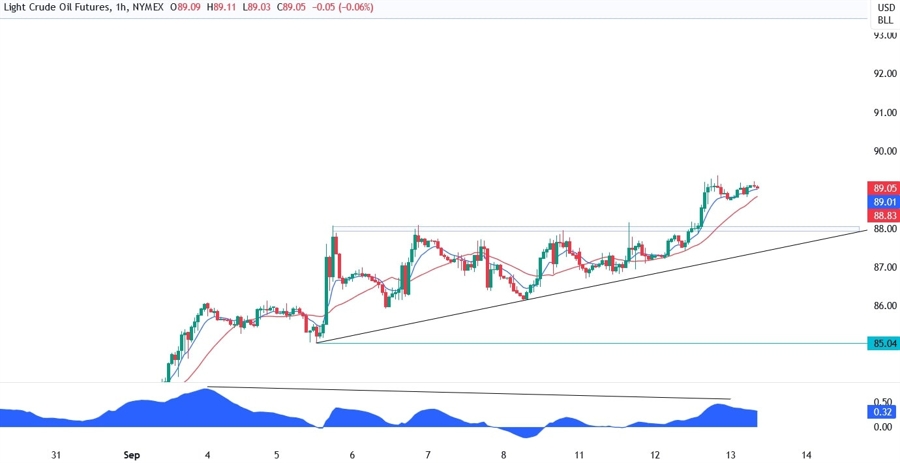
On the 1 hour chart, we can see more clearly the short term price action and the support zone around the $88 level. This level will be key as we will either get a bounce and probably see a rally into the $93 resistance or a break and a fall into the $85 level first and the $83 support next.
Upcoming Events
This week we have many important events. Today is the US CPI Day, which is expected to show an increase in headline inflation due to higher energy prices but further disinflation in the core measure. Tomorrow, we will see the latest US Jobless Claims, PPI and Retail Sales data. Finally on Friday, we get the University of Michigan Consumer Sentiment report. Crude Oil might react more to growth related data like Jobless Claims and Retail Sales. In fact, if we get very bad readings, we should see a selloff in Crude Oil given the stretched levels, but if the data remains solid, then the bulls will still be in charge.
See also the video below


