Crude Oil continues to be supported amid a confluence of positive supply and demand drivers that are pushing the prices back into the $80 level with high chances of even higher prices to come. In fact, on the supply side, the tensions in the Red Sea are still present and overall, there’s still a high geopolitical risk in the Middle East with the war between Israel and Hamas not looking like it’s going to stop anytime soon.
On the demand side, the recent economic data has been showing a strong reacceleration in activity which is supported by the rate cuts expectations and the end of the tightening cycle. On top of that, the PBoC recently decided to cut its Reserve Requirement Ratio by 50 bps and there are expectations for more easing measures to follow given the fragile Chinese stock market.
WTI Crude Oil Technical Analysis – Daily Timeframe
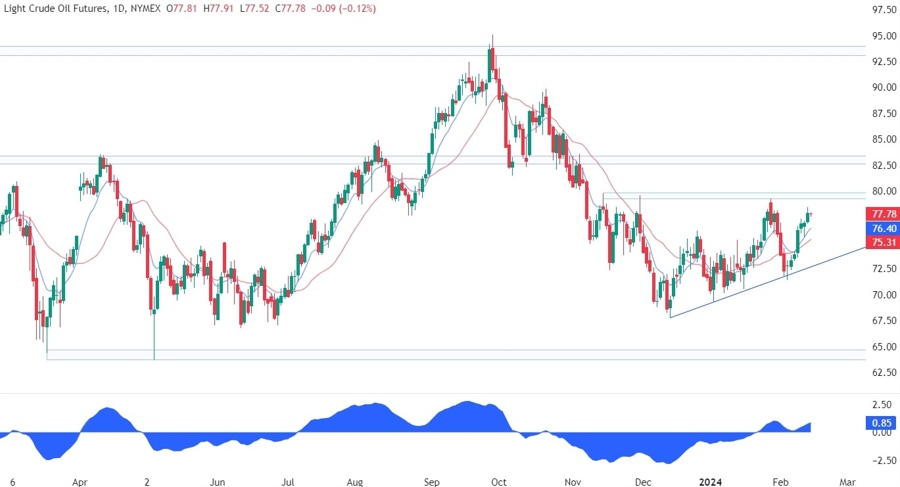
On the daily chart, we can see that Crude Oil bounced on the trendline where the buyers stepped in with a defined risk below it and rallied strongly into new highs with the market now eyeing the $80 resistance. That’s where we will likely find the sellers piling in with a defined risk above the resistance to position for a drop back into the trendline. The buyers, on the other hand, will want to see the price breaking higher to increase the bullish bets into the key $83 level.
WTI Crude Oil Technical Analysis – 4 hour Timeframe
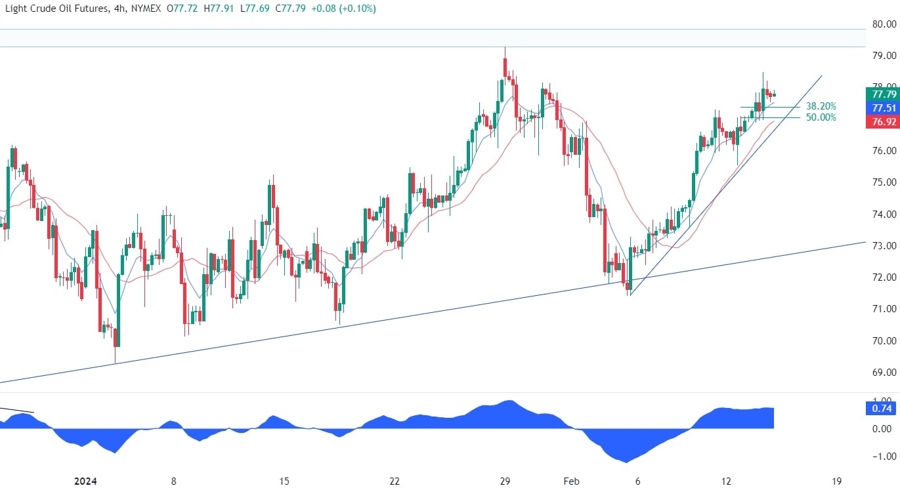
On the 4 hour chart, we can see that we have another minor trendline which is defining the current upward momentum. If we get a pullback into the trendline we can expect the buyers to lean on it as they will also find the confluence with the Fibonacci retracement levels and the red 21 moving average. The sellers, on the other hand, will want to see the price breaking lower to invalidate the bullish setup and position for a drop into the major trendline.
WTI Crude Oil Technical Analysis – 1 hour Timeframe
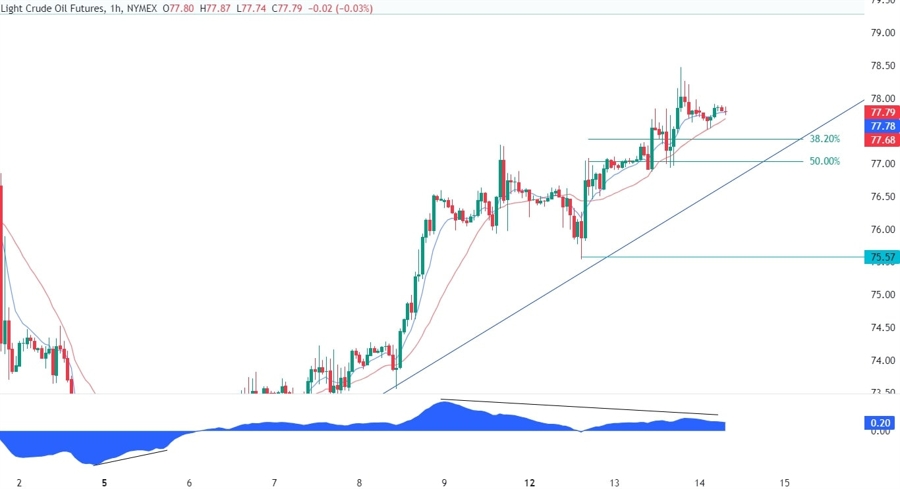
On the 1 hour chart, we can see more closely the recent price action and the bullish setup around the trendline. We can also notice that the latest leg higher is diverging with the MACD which is generally a sign of weakening momentum often followed by pullbacks or reversals. In this case, it could be a signal for a pullback into the trendline, but if the price were to break below it, then we can expect a quick selloff into the most recent swing low at $75.50 which will be the last line of defence for the buyers before the sellers take control.
Upcoming Events
Tomorrow we will see latest US Jobless Claims figures and the US Retail Sales data, while on Friday, we conclude the week with the US PPI and the University of Michigan Consumer Sentiment survey. Weak data is likely to weigh on Crude Oil in the short term, while strong figures should give it a boost.
See the video below


