Crude Oil continues to display a choppy price action as the future supply and demand outlook remains mixed. More recently though, the market started to have more tailwinds than headwinds as the supply and demand drivers aligned. In fact, on the supply side, the tensions in the Red Sea are still present and the recent escalation with the US and UK striking Houthis targets in Yemen is keeping supply fears high. On the demand side, the recent economic data has been showing a reacceleration in activity which is supported by the rate cuts expectations. Until the music stops, we should continue to see bids coming in the oil market with the natural target standing around the $80 level.
WTI Crude Oil Technical Analysis – Daily Timeframe
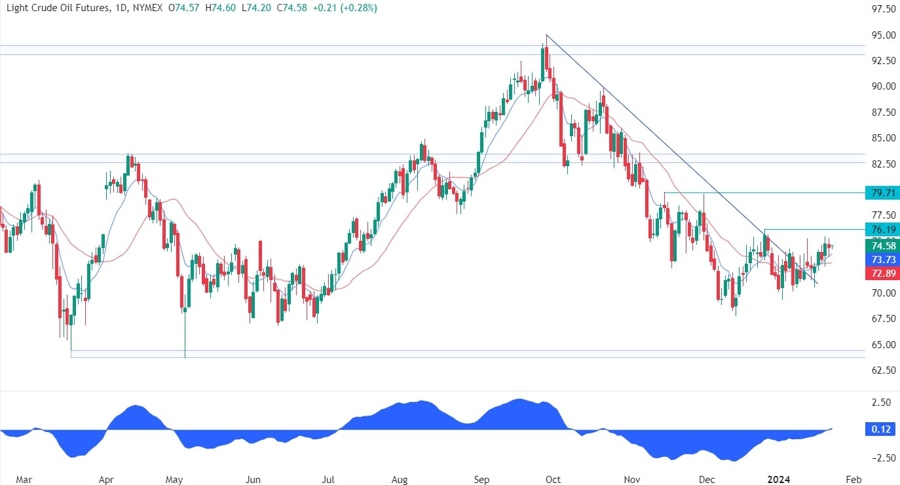
On the daily chart, we can see that Crude Oil recently broke above the key trendline but instead of rallying strongly into the next resistance, the price started to range with a slightly bullish tilt. Given the current tailwinds, we should see the price reach at least the $76.20 level and after a breakout the $80 handle. The sellers, on the other hand, will likely step in around those levels to position for a drop into the $64 support.
WTI Crude Oil Technical Analysis – 4 hour Timeframe
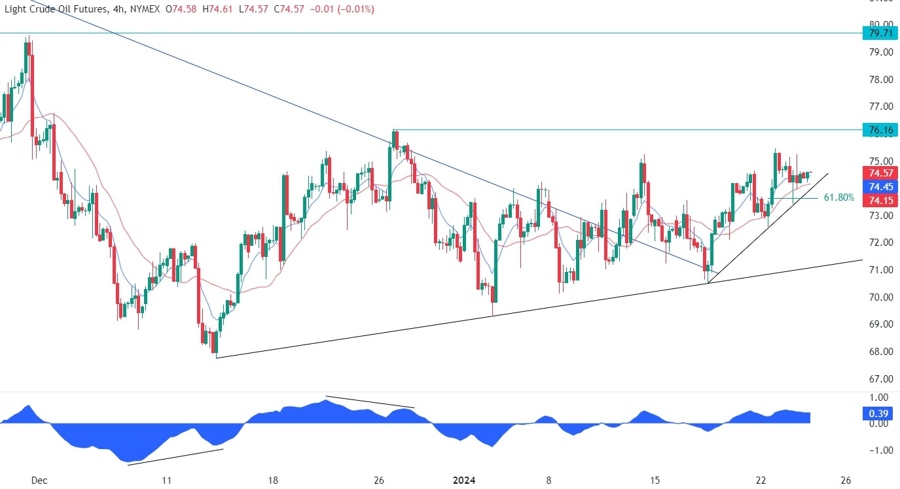
On the 4 hour chart, we can see that the price recently pulled back and bounced from the upward minor trendline where we had also the 61.8% Fibonacci retracement level for confluence. The buyers stepped in with a defined risk below the trendline to position for a rally into the $76.20 level. The sellers, on the other hand, will want to see the price breaking below the trendline to pile in and target the major trendline before looking for a continuation into the $64 support.
WTI Crude Oil Technical Analysis – 1 hour Timeframe
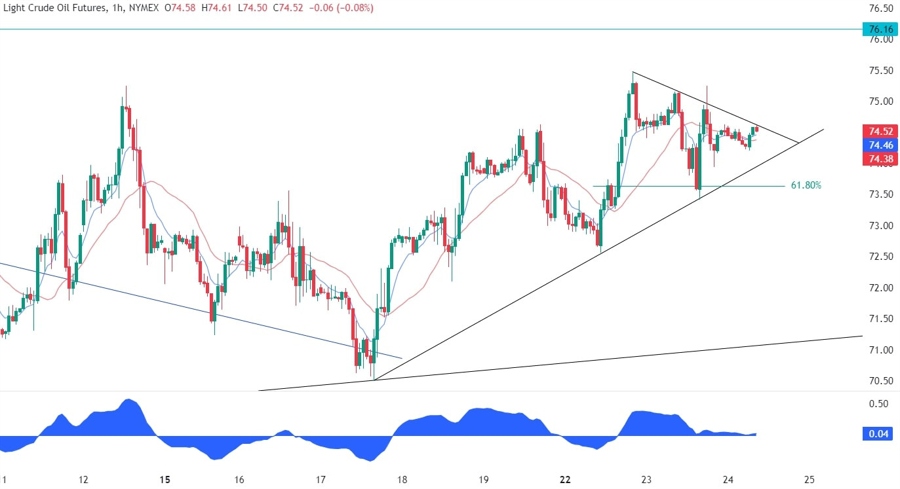
On the 1 hour chart, we can see that we have a counter-trendline where the sellers have been leaning onto to position for a breakout below the upward trendline. The buyers should increase the bullish bets into the $76.20 level with the breakout. Conversely, if the breakout were to fail with the price breaking below the upward trendline, the bullish setup would be invalidated, and the sellers will regain control.
Upcoming Events
Today the main event will be the US PMIs as the market will want to see how business activity has fared in January after some worrying data from regional surveys. Tomorrow, we have the Advance US Q4 GDP and the latest US Jobless Claims figures. Finally, on Friday we conclude the week with the US PCE report. Weak data is likely to weigh on Crude Oil while strong figures should keep on supporting the market.
See the video below


