Crude Oil has been rallying quite steadily since last Wednesday as the surprisingly dovish FOMC decision triggered a “buy everything” type of reaction in the markets. The easing in financial conditions decreased some concerns around demand and led to an extended pullback in Crude Oil with traders assigning some risk of another inflationary impulse in the coming months. The market is also adding some geopolitical risk premium due to the attacks in the Red Sea by Yemen’s Houthi militants that could disrupt the supply side, although the US has already launched a multinational task force to safeguard the Red Sea commerce.
WTI Crude Oil Technical Analysis – Daily Timeframe
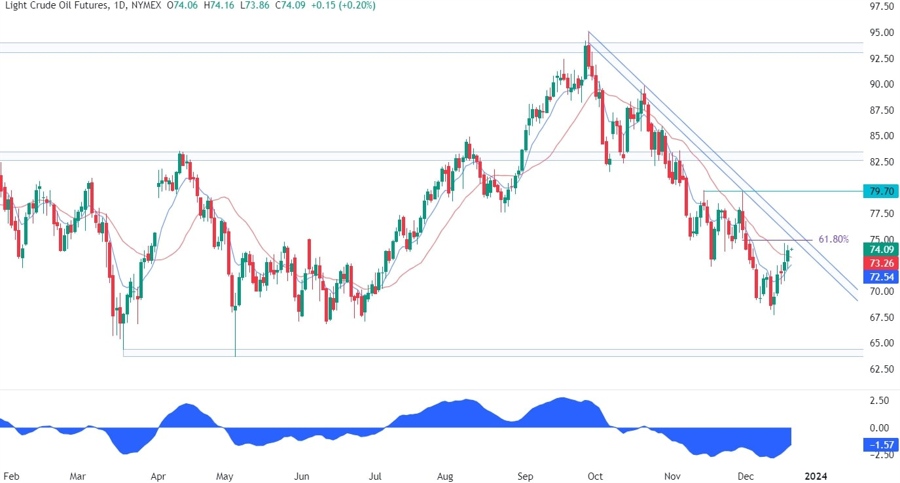
On the daily chart, we can see that Crude Oil is now close to a key resistance zone where we can find the confluence with the trendline, the 61.8% Fibonacci retracement level and the red 21 moving average. This is where the sellers are likely to step in with a defined risk above the trendline to position for another drop into the $64 support. The buyers, on the other hand, will want to see the price breaking higher to invalidate the bearish setup and extend the rally into the $80 level.
WTI Crude Oil Technical Analysis – 4 hour Timeframe
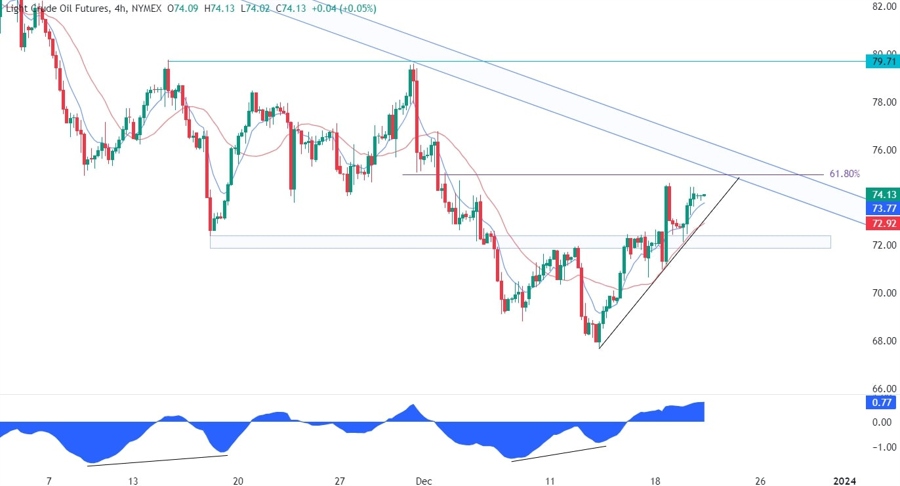
On the 4 hour chart, we can see that we had a divergence with the MACD around the $68 level which is generally a sign of weakening momentum often followed by pullbacks or reversals. The price recently broke above the resistance zone around the $72 level, retested it and continued higher into the trendline. We now have an upward trendline supporting the current uptrend where the buyers are likely to lean onto as they will also have the red 21 moving average for confluence.
WTI Crude Oil Technical Analysis – 1 hour Timeframe
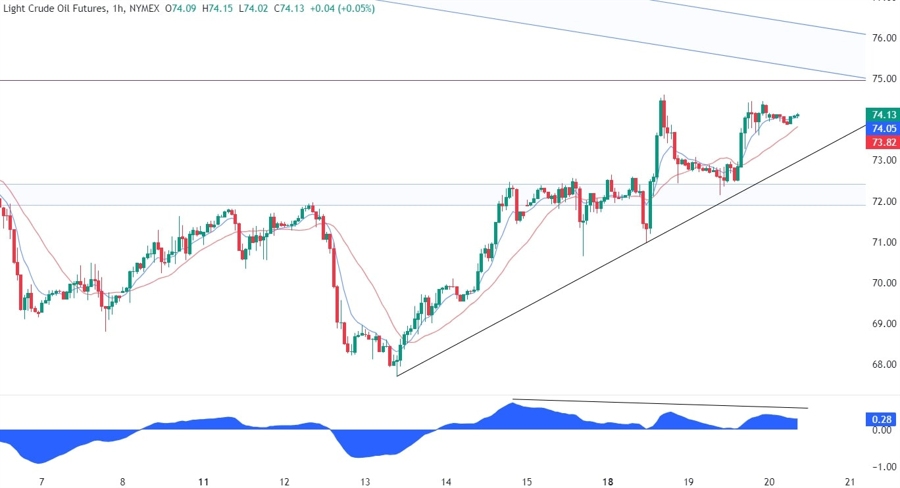
On the 1 hour chart, we can see that on this timeframe the price has been diverging with the MACD since the break above the $72 resistance. This might be another bearish confluence for the sellers signalling a possible reversal right around the major trendline. If the price breaks further below the minor upward trendline, the sellers will increase the bearish bets into the $64 support.
Upcoming Events
This week is a bit empty on the data front as we head into the Christmas holidays. Today, we have the US Consumer Confidence report. Tomorrow, we get the latest US Jobless Claims data, while on Friday we conclude the week with the US PCE report. Weak data is likely to weigh on Crude Oil due to demand fears, while strong figures should keep on supporting the market.
See the video below


