Fundamental Overview
The USD opened higher today and continued to dominate throughout the Asian session as we got once again some tariffs headlines that weighed on the risk sentiment. In fact, late yesterday Trump announced that he will impose 25% tariffs and sanctions on Colombia because they refused to take the deported migrants.
Colombia retaliated soon after by imposing 25% tariffs on US imports. Late in the Asian session though, we got the news that the US will hold the tariffs and sanctions in reserve as Colombia accepted the illegal migrants returned from the US. That might see the US Dollar getting weaker again.
On the JPY side, the BoJ hiked interest rates by 25 bps as widely expected last week but didn’t offer much in terms of forward guidance which capped the JPY gains as the market already expected a hike and then another some time in the second half of this year.
USDJPY Technical Analysis – Daily Timeframe
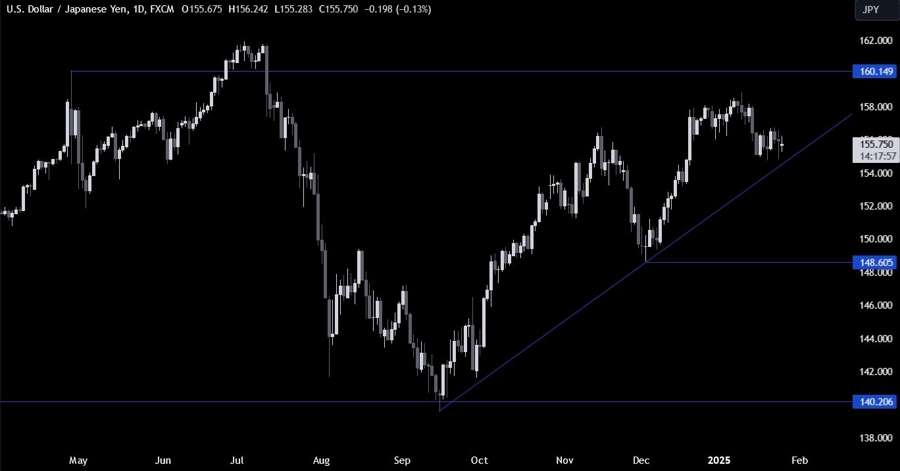
On the daily chart, we can see that USDJPY has been consolidating for couple of weeks with the price now being very close to the major trendline. The buyers will likely step in around the trendline with a defined risk below it to position for a rally into the 160.00 handle. The sellers, on the other hand, will want to see the price breaking lower to increase the bearish bets into the 149.00 handle next.
USDJPY Technical Analysis – 4 hour Timeframe
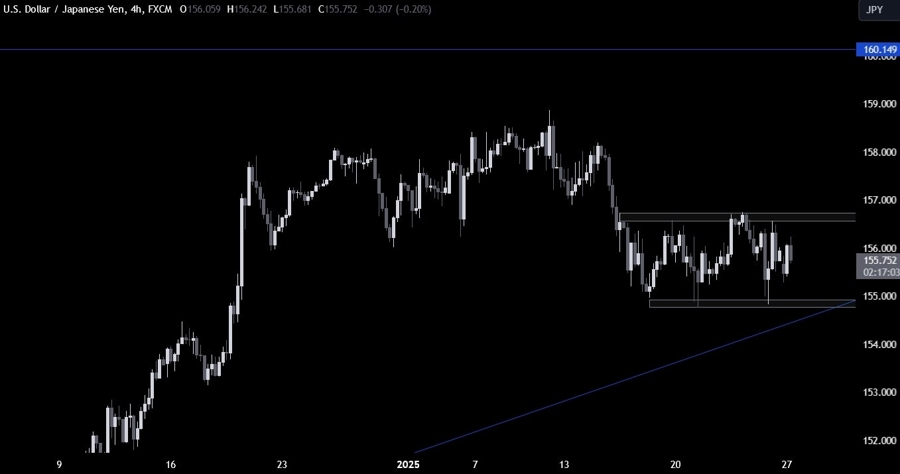
On the 4 hour chart, we can see more clearly the rangebound price action between the 154.80 support and the 156.60 resistance. The market participants will keep on playing the range buy buying at support and selling at resistance until we get a breakout on either side.
USDJPY Technical Analysis – 1 hour Timeframe
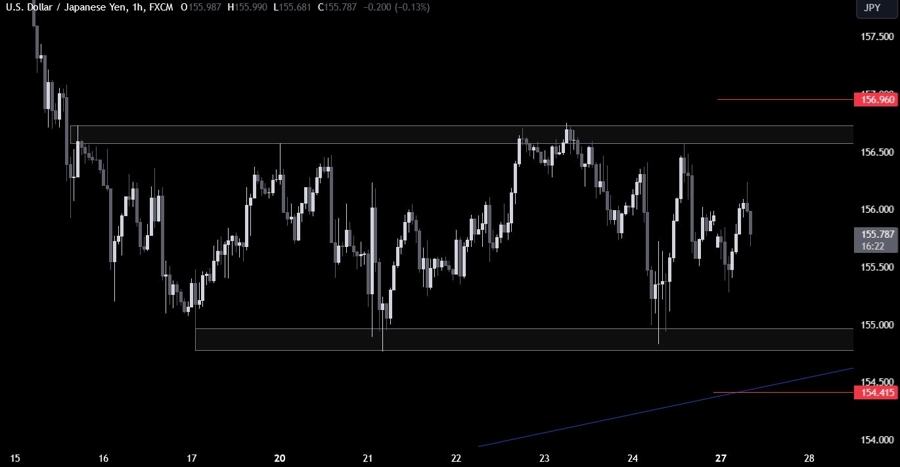
On the 1 hour chart, there’s not much we can add here as the buyers will look for a bounce around the support or a break above the resistance, while the sellers will look for a rejection around the resistance or a break below the support. The red lines define the average daily range for today.
Upcoming Catalysts
Tomorrow we get the US Consumer Confidence data. On Wednesday, we have the FOMC Policy Decision. On Thursday, we get the US Q4 GDP report and the latest US Jobless Claims figures. On Friday, we conclude the week with the US PCE and the US Employment Cost Index.


