USD
- The Fed left interest rates unchanged as expected at the last meeting and dropped the tightening bias in the statement.
- The US PCE came in line with expectations.
- The NFP report beat expectations on the headline number, but the unemployment rate and the average hourly earnings missed notably.
- The latest US ISM Manufacturing PMI missed expectations by a big margin remaining in contraction with the US ISM Services PMI following suit but holding on in expansion.
- The US Consumer Confidence missed expectations across the board.
- The market expects the first rate cut in June.
JPY
- The BoJ kept its monetary policy unchanged as expected at the last meeting with interest rates at -0.10% and the 10 year JGB yield target at 0% with 1% as a reference cap.
- The last Japanese CPI beat expectations although all measures eased further from the prior readings.
- The latest Unemployment Rate remained unchanged hovering around cycle lows.
- The Japanese PMIs improved for both the Manufacturing and Services measures although the former remains in contractionary territory.
- The Japanese wage data beat expectations by a big margin.
- The Tokyo CPI, which is seen as a leading indicator for National CPI, recently came in line with expectations with the measures increasing from the prior report.
- The market sees a 50/50 chance that the BoJ hikes rates in March.
USDJPY Technical Analysis – Daily Timeframe
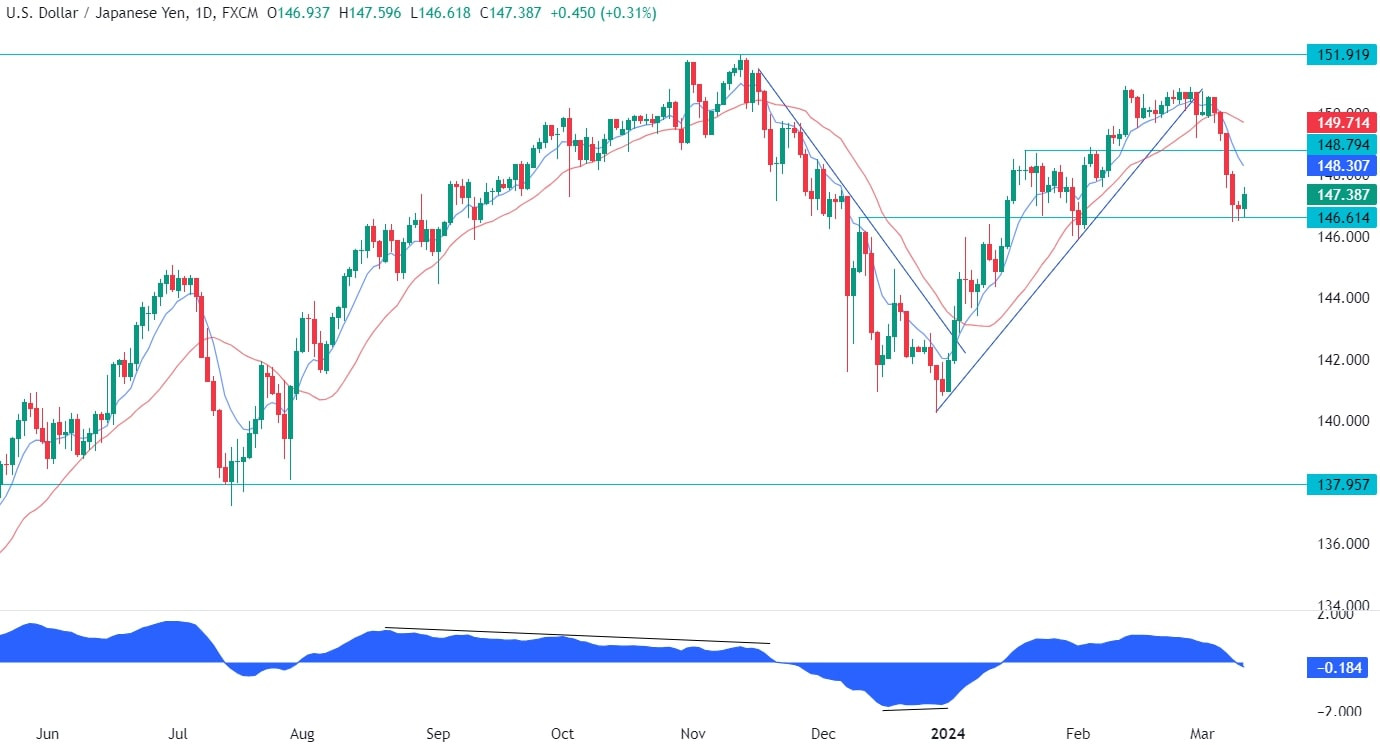
On the daily chart, we can see that USDJPY sold off recently as the market participants started to position for the BoJ to exit the negative interest rates policy (NIRP) probably at the upcoming meeting on the 19th of March. The speculation started with the BoJ members delivering hawkish comments and the Japanese wage data beating expectations by a big margin. The pair bounced on the key 146.60 level as the price got overstretched but we can expect the sellers to sell the rallies into the BoJ meeting next week.
USDJPY Technical Analysis – 4 hour Timeframe
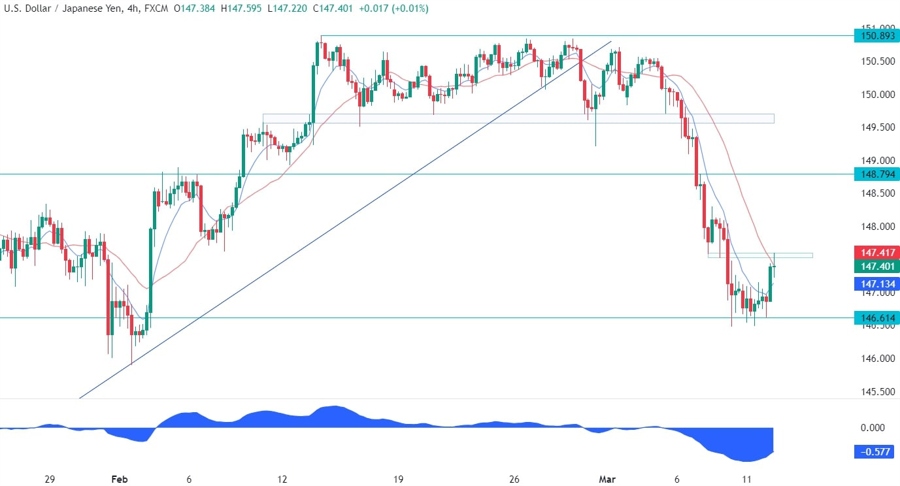
On the 4 hour chart, we can see that the first opportunity for the sellers is standing around the 147.50 level where we can find the previous swing low level and the red 21 moving average. This is where we can expect the sellers to step in with a defined risk above the level to position for a break below the 146.60 support and target the 145 handle next. The buyers, on the other hand, will want to see the price breaking higher to increase the bullish bets into new highs.
USDJPY Technical Analysis – 1 hour Timeframe
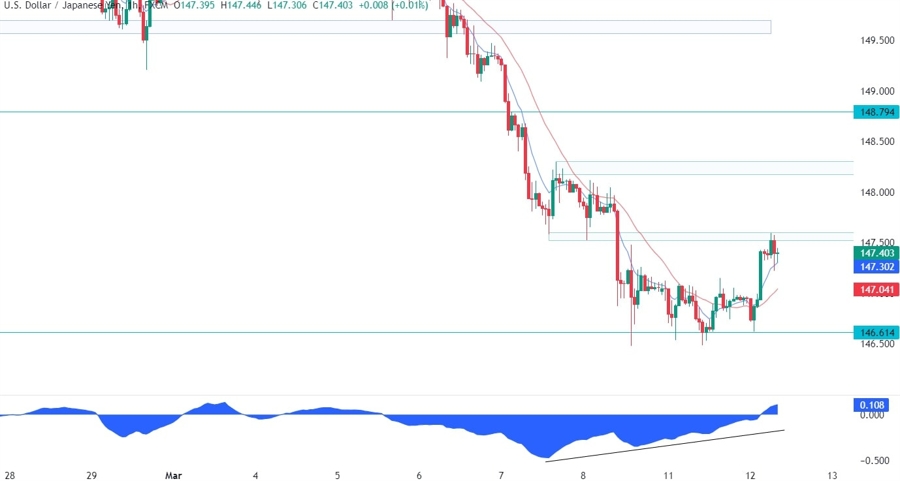
On the 1 hour chart, we can see that the price started to diverge with the MACD as it approached the key 146.60 level. This is generally a sign of weakening momentum often followed by pullbacks or reversals. In this case, if the price were to break above the 147.50 level, then we can expect the sellers to step in around the 148.20 level which is generally the target of the divergent formation. A break above the 148.20 level would see the buyers increasing further their bullish bets into the highs.
Upcoming Events
Today we have the main event of the week, that is the US CPI report. On Thursday we get the US PPI, the US Retail Sales and the US Jobless Claims figures. On Friday, we conclude the week with the University of Michigan Consumer Sentiment survey.


