USD
- The Fed left interest rates unchanged as expected at the last meeting while dropping the tightening bias in the statement but adding a slight pushback against a March rate cut.
- The US CPI beat expectations for the second consecutive month with the disinflationary trend reversing.
- The US PPI beat expectations across the board by a big margin.
- The US Jobless Claims beat expectations with the data remaining steady.
- The latest US PMIs increased further from the prior month with the Manufacturing PMI beating expectations and the Services PMI missing.
- The US Retail Sales missed expectations across the board by a big margin.
- The market now expects the first rate cut in June.
JPY
- The BoJ kept its monetary policy unchanged as expected with interest rates at -0.10% and the 10 year JGB yield target at 0% with 1% as a reference cap.
- The Japanese CPI eased further across all measures which makes it even harder to expect a rate hike from the BoJ anytime soon.
- The latest Unemployment Rate ticked lower hovering around cycle lows.
- The Japanese PMIs improved for both the Manufacturing and Services measures although the former remains in contractionary territory.
- The Japanese wage data missed expectations again recently although there was a pick up from the prior reading.
- The Tokyo CPI, which is seen as a leading indicator for National CPI, fell much more than expected recently.
- The market expects the BoJ to hike rates in Q2.
USDJPY Technical Analysis – Daily Timeframe
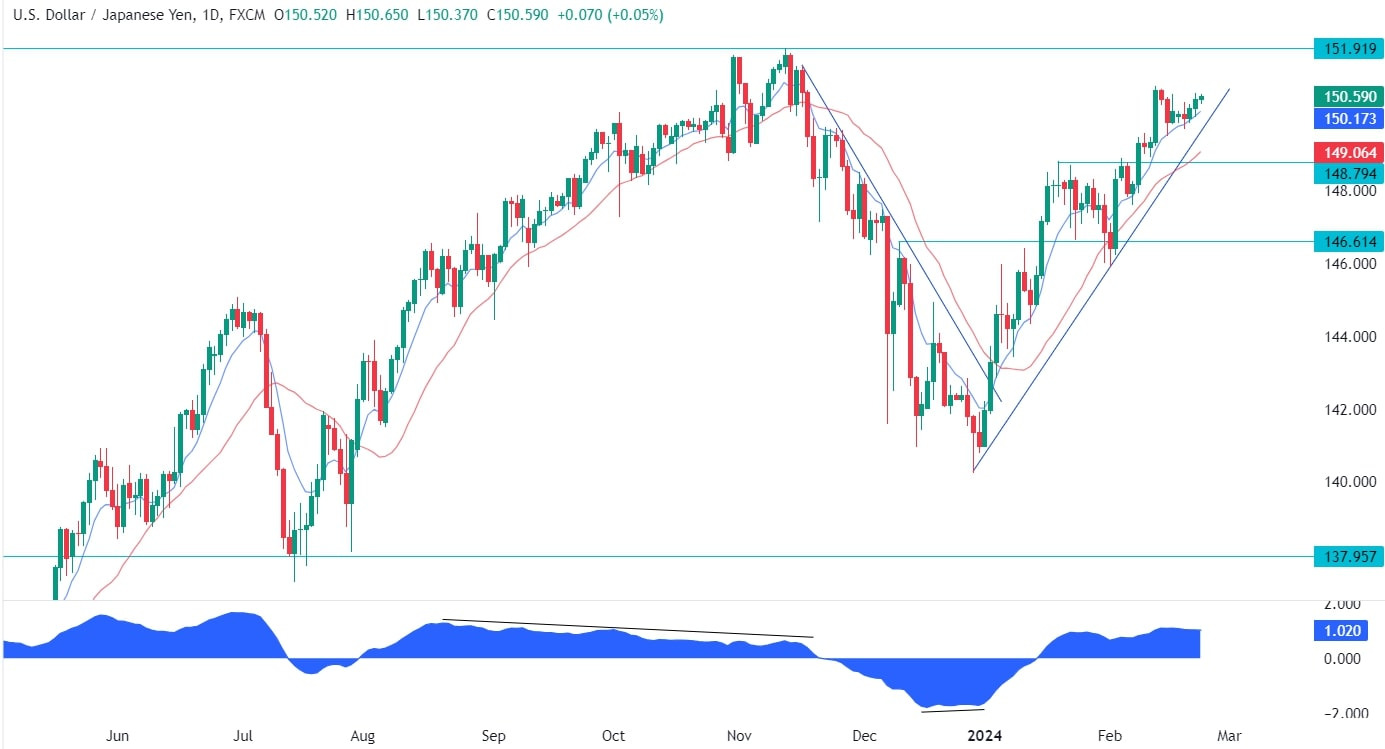
On the daily chart, we can see that USDJPY is getting closer and closer to the cycle high around the 151.90 level. We’ve been stuck in a consolidation since the hot US CPI release and despite more strong US data, the pair hasn’t managed to sustain a rally. We can see that we have a trendline defining the current uptrend and we can expect the buyers to lean on it to position for a rally into the cycle high. The sellers, on the other hand, will want to see the price breaking lower to position for a drop into the 148.80 support.
USDJPY Technical Analysis – 4 hour Timeframe
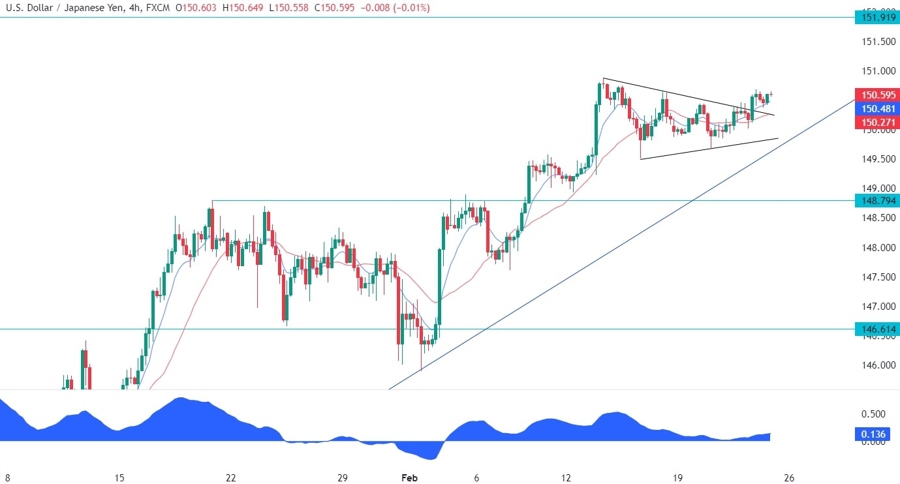
On the 4 hour chart, we can see that the recent price action formed what looks like a symmetrical triangle. The price broke to the upside yesterday and the buyers piled in to target the cycle high. We might see a retest of the broken upper trendline before the rally but if that won’t be the case, the buyers will still have another opportunity at the major trendline.
USDJPY Technical Analysis – 1 hour Timeframe
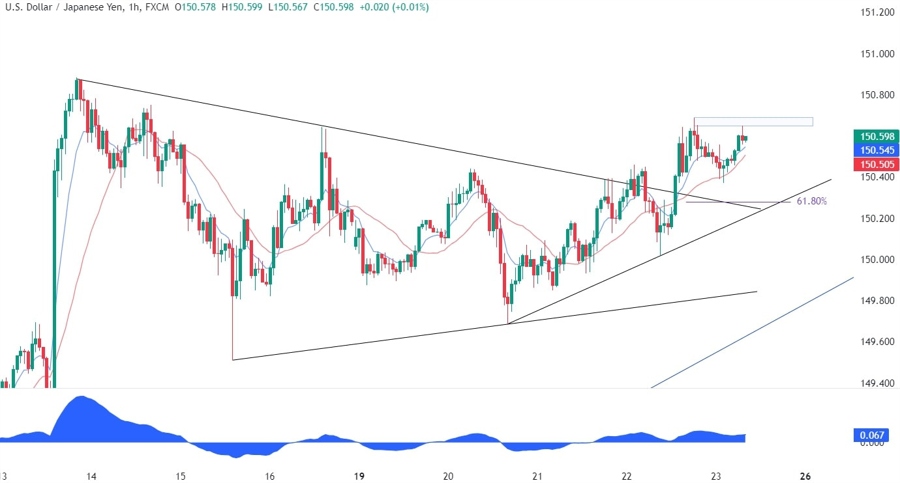
On the 1 hour chart, we can see that we have a minor upward trendline now where we can also find the 61.8% Fibonacci retracement level for confluence. In case we see a pullback from these levels, this is where we can expect the buyers to step in with a defined risk below the trendline to position for the rally into the cycle high. Alternatively, the buyers will increase the bullish bets in case we get a break of the 150.70 high in the next days.


