USD
- The Fed left interest rates unchanged as expected while dropping the tightening bias in the statement but adding a slight pushback against a March rate cut.
- Fed Chair Powell stressed that they want to see more evidence of inflation falling back to target and that a rate cut in March is not their base case.
- The US CPI beat expectations for the second consecutive month with the disinflationary trend reversing.
- The US PPI beat expectations across the board by a big margin.
- The US Initial Claims beat expectations while Continuing Claims missed. Overall, the data remains steady.
- The ISM Manufacturing PMI surprised to the upside with the new orders index, which is considered a leading indicator, jumping back into expansion. Similarly, the ISM Services PMI beat expectations across the board with the employment sub-index erasing the prior drop and prices paid jumping above 60.
- The US Retail Sales missed expectations across the board by a big margin.
- The market now expects the first rate cut in June.
JPY
- The BoJ kept its monetary policy unchanged as expected with interest rates at -0.10% and the 10 year JGB yield target at 0% with 1% as a reference cap.
- The Japanese CPI eased further across all measures which makes it even harder to expect a rate hike from the BoJ anytime soon.
- The latest Unemployment Rate ticked lower hovering around cycle lows.
- The Japanese PMIs improved for both the Manufacturing and Services measures although the former remains in contractionary territory.
- The Japanese wage data missed expectations again recently although there was a pick up from the prior reading.
- The Tokyo CPI, which is seen as a leading indicator for National CPI, fell much more than expected recently.
- The market expects the BoJ to hike rates in Q2.
USDJPY Technical Analysis – Daily Timeframe
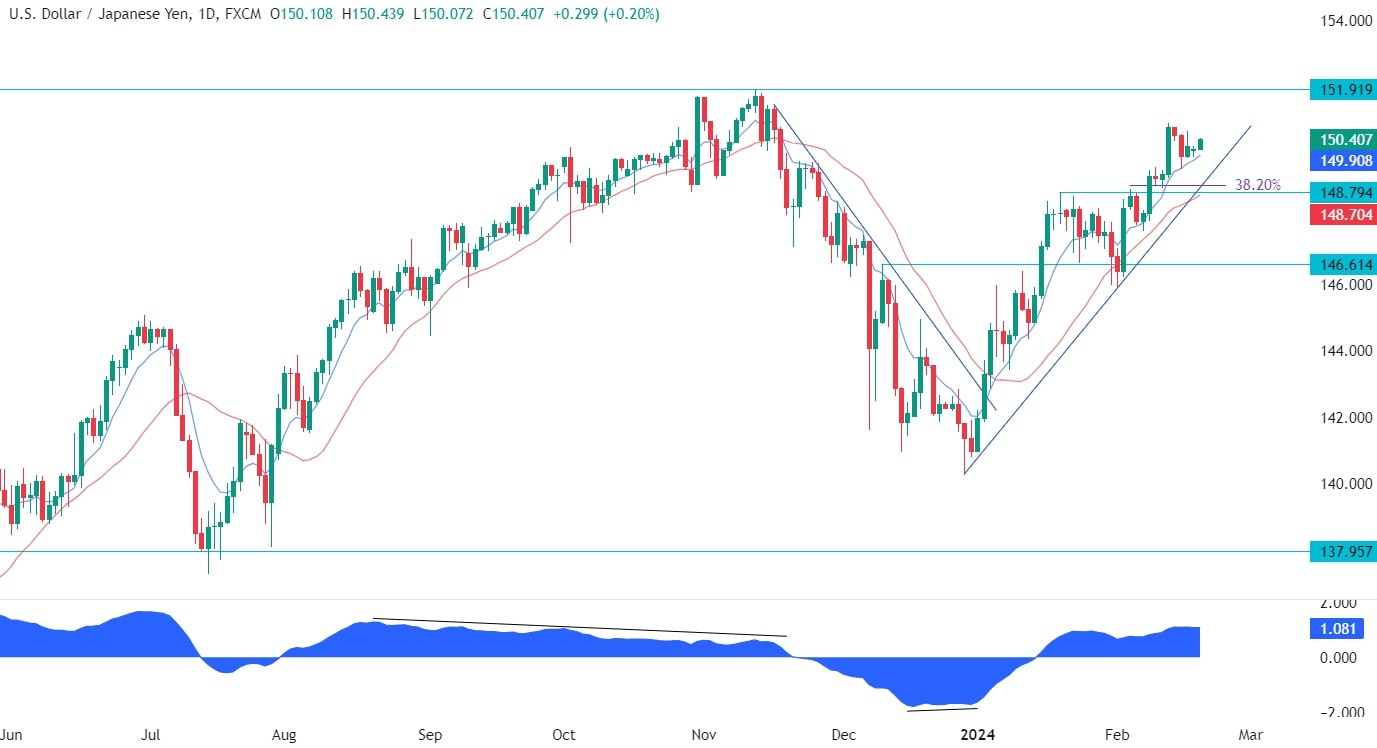
On the daily chart, we can see that USDJPY is getting closer to the cycle high around the 151.90 level. From a risk management perspective, the buyers will have a much better risk to reward setup around the trendline where they will also find the confluence with the 148.80 support, the red 21 moving average and the 38.2% Fibonacci retracement level. The sellers, on the other hand, will want to see the price breaking lower to invalidate the bullish setup and position for a drop into the 146.60 level.
USDJPY Technical Analysis – 4 hour Timeframe
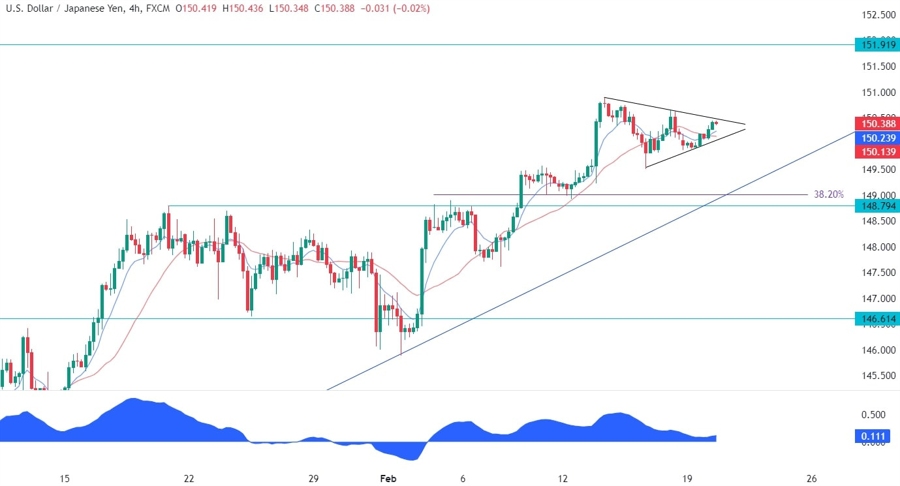
On the 4 hour chart, we can see that the price has been consolidating since the hot US CPI report and the price action formed what looks like a symmetrical triangle. The price can break on either side of the pattern but what follows next is generally a strong move in the direction of the breakout. The buyers will want to see the price breaking higher to increase the bullish bets into the cycle high, while the sellers will want to see it breaking lower to target the 148.80 support.
USDJPY Technical Analysis – 1 hour Timeframe
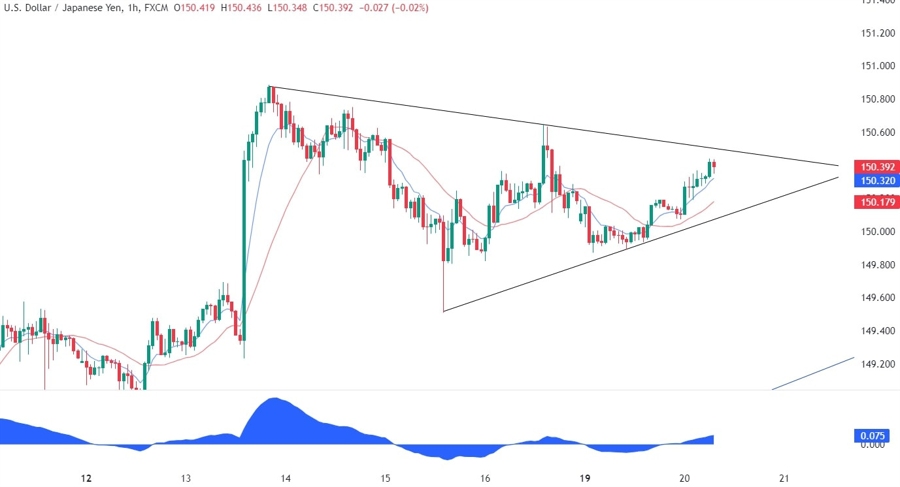
On the 1 hour chart, we can see more closely the recent price action inside the triangle. There’s not much to do here other than waiting for a breakout or a catalyst and go with the flow.
Upcoming Events
This week is basically empty on the data front with just the release of the FOMC Meeting Minutes tomorrow followed by the Japanese and the US PMIs, and the US Jobless Claims on Thursday.


