USD
- The Fed left interest rates unchanged as expected while dropping the tightening bias in the statement but adding a slight pushback against a March rate cut.
- Fed Chair Powell stressed that they want to see more evidence of inflation falling back to target and that a rate cut in March is not their base case.
- The US CPI beat expectations for the second consecutive month with the disinflationary trend reversing.
- The US Initial Claims beat expectations while Continuing Claims missed. Overall, the data remains steady.
- The ISM Manufacturing PMI surprised to the upside with the new orders index, which is considered a leading indicator, jumping back into expansion. Similarly, the ISM Services PMI beat expectations across the board with the employment sub-index erasing the prior drop and prices paid jumping above 60.
- The US Retail Sales missed expectations across the board by a big margin.
- The market now expects the first rate cut in June.
JPY
- The BoJ kept its monetary policy unchanged as expected with interest rates at -0.10% and the 10 year JGB yield target at 0% with 1% as a reference cap.
- The Japanese CPI eased further across all measures which makes it even harder to expect a rate hike from the BoJ anytime soon.
- The latest Unemployment Rate ticked lower hovering around cycle lows.
- The Japanese PMIs improved for both the Manufacturing and Services measures although the former remains in contractionary territory.
- The Japanese wage data missed expectations again recently although there was a pick up from the prior reading.
- The Tokyo CPI, which is seen as a leading indicator for National CPI, fell much more than expected recently.
- The market expects the BoJ to hike rates in Q2.
USDJPY Technical Analysis – Daily Timeframe
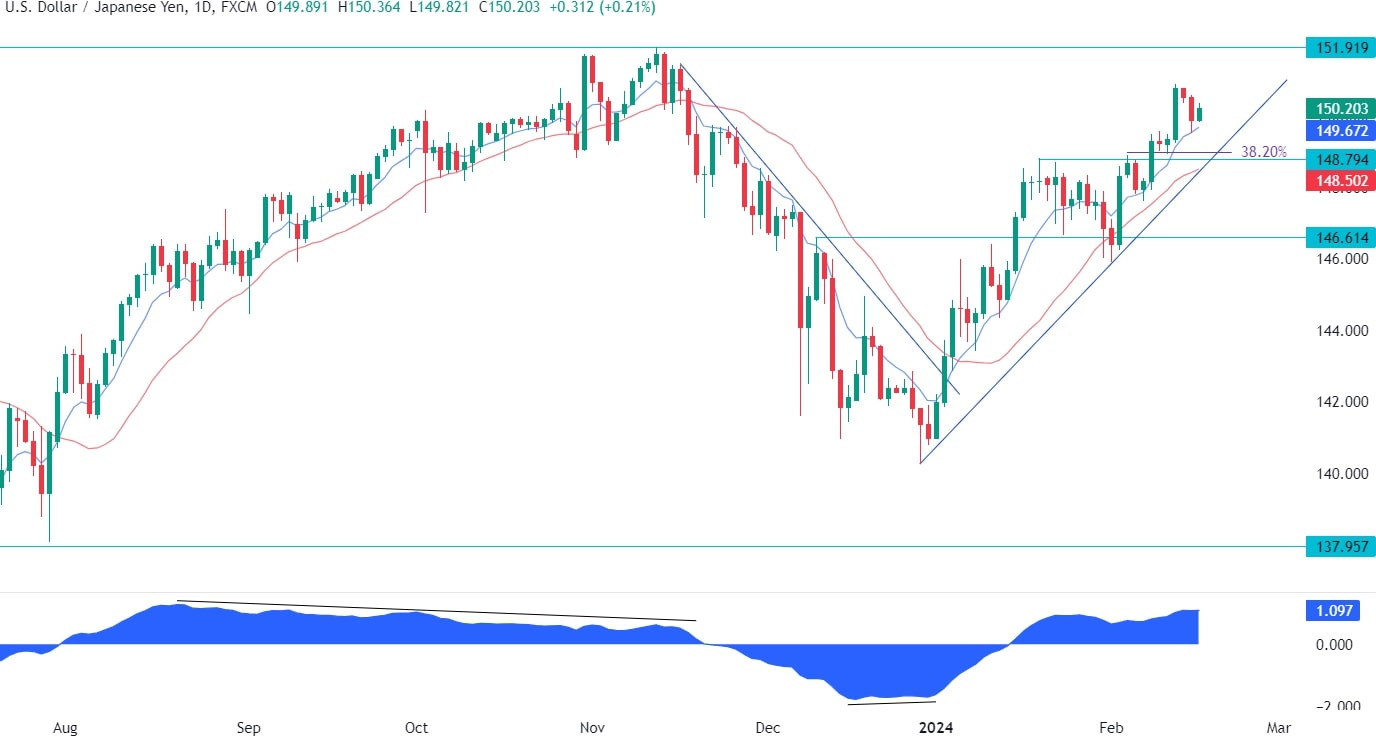
On the daily chart, we can see that USDJPY is getting closer to the cycle high around the 151.90 level. From a risk management perspective, the buyers will have a much better risk to reward setup around the trendline where they will also find the confluence with the 148.80 support, the red 21 moving average and the 38.2% Fibonacci retracement level. The sellers, on the other hand, will want to see the price breaking lower to invalidate the bullish setup and position for a drop into the 146.60 level.
USDJPY Technical Analysis – 4 hour Timeframe
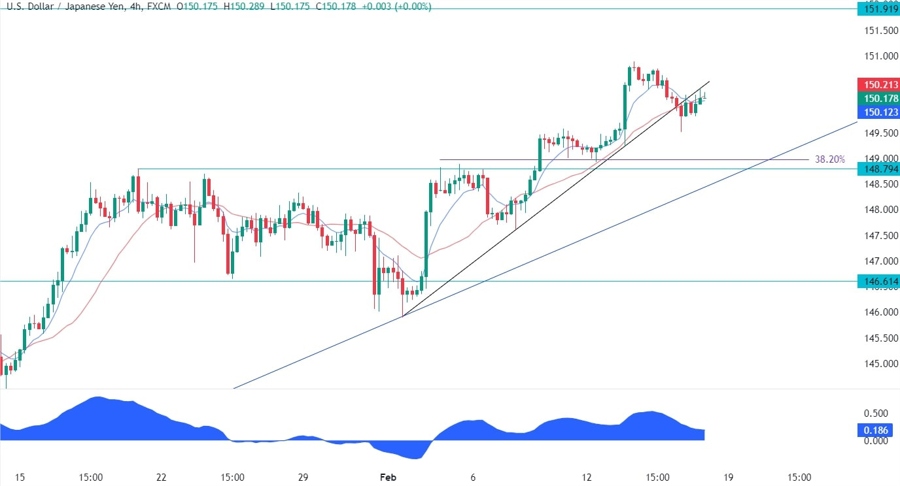
On the 4 hour chart, we can see that the price yesterday broke below the minor upward trendline that was defining the strong upward momentum. This might be a sign of a bigger pullback to come which should resolve right around the 148.80 support zone. We can expect the sellers to step in here with a defined risk above the trendline to position for a drop into the support.
USDJPY Technical Analysis – 1 hour Timeframe
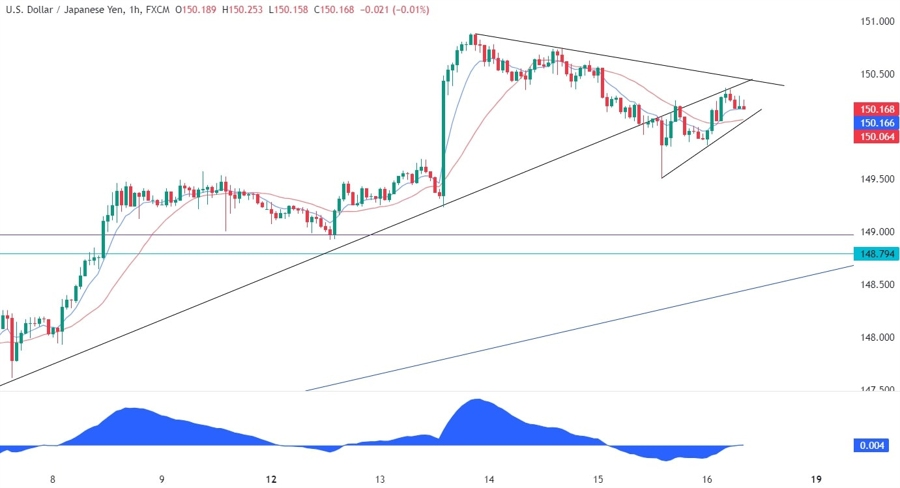
On the 1 hour chart, we can see that we have a counter-trendline that is defining the pullback into the downward trendline. A break below the counter-trendline should see the sellers to increase the bearish bets into the support. The buyers, on the other hand, will want to see the price breaking above the downward trendline to pile in and target the cycle high around the 151.90 level.
Upcoming Events
Today we get the US PPI data and the University of Michigan Consumer Sentiment survey.
See the video below


