USD
- The Fed left interest rates unchanged as expected with basically no change to the statement.
- Fed Chair Powell stressed once again that they are proceeding carefully as the full effects of policy tightening have yet to be felt.
- The recent US CPI missed expectations across the board bringing the expectations for rate cuts forward.
- The labour market is starting to show weakness as Continuing Claims are now rising at a fast pace and the recent NFP report missed across the board.
- The US Consumer Confidence and University of Michigan Consumer Sentiment continue to fall.
- The recent US ISM Manufacturing PMI missed expectations by a big margin, followed by a disappointing ISM Services PMI, although the latter remained in expansion.
- The US Retail Sales beat expectations, while the US PPI missed forecasts by a big margin.
- The recent Fedspeak has been leaning on the hawkish side, but this week’s inflation report pretty much confirmed that the Fed might be done for the cycle.
- The market doesn’t expect the Fed to hike anymore.
JPY
- The BoJ kept its monetary policy basically unchanged but formally widened the YCC to 1% on the 10-year JGBs stating that it will be a reference cap.
- Governor Ueda repeated once again that they won’t hesitate to take easing measures if needed and that they are not foreseeing sustainable price increases.
- The recent Japanese CPIshowed that inflationary pressures remain high with the core-core reading hovering at the cycle highs.
- The Unemployment Rate remained unchanged near cycle lows.
- The Japanese Manufacturing PMI matched the prior reading remaining in contraction with the Services PMI falling but holding on in expansion.
- The latest Japanese wage data beat expectations. As a reminder the BoJ is focusing on wage growth to decide whether to tweak its monetary policy.
- The market expects the BoJ to keep interest rates unchanged at the next meeting as well.
USDJPY Technical Analysis – Daily Timeframe
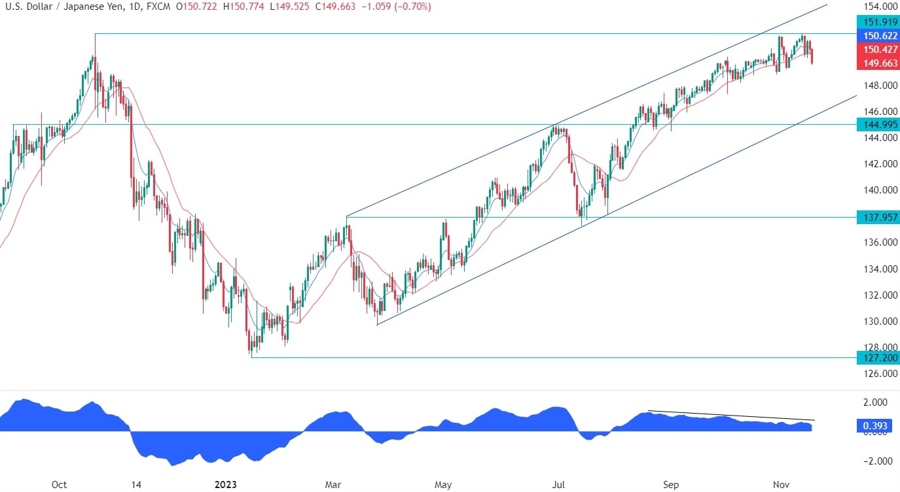
On the daily chart, we can see that USDJPY managed to retest the cycle high at 151.90 before falling back to the 150.00 handle following the miss in the US CPI report. The US data has been deteriorating pretty fast recently and that could mark the top for the pair. The big divergence with the MACD is pointing to a correction into the major trendline around the 146.00 level and given the selloff in Treasury yields, it’s highly likely that we will see the pair falling further.
USDJPY Technical Analysis – 4 hour Timeframe
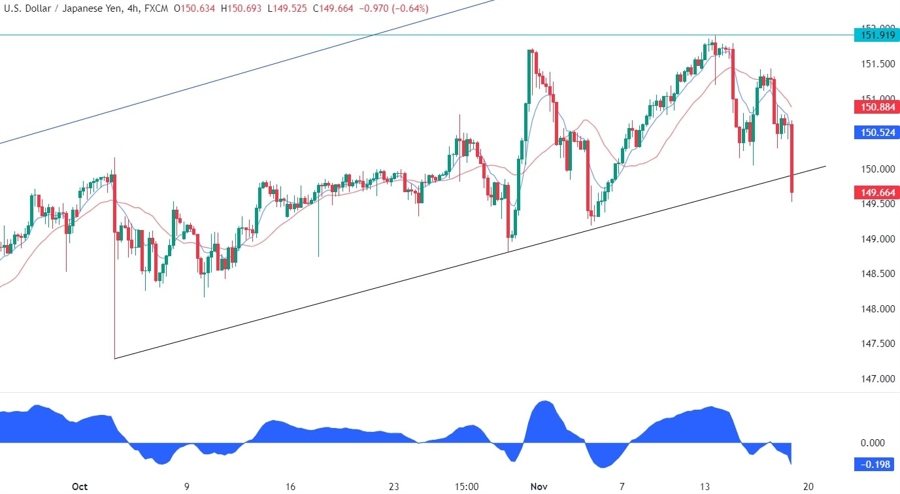
On the 4 hour chart, we can see that USDJPY sold off yesterday following the miss in the US Jobless Claims figures and after a brief consolidation, the pair this morning broke through the trendline. This is another confirmation that the bearish momentum is gathering pace, and the sellers will start to gain even more conviction for a drop towards the 146.00 level.
USDJPY Technical Analysis – 1 hour Timeframe
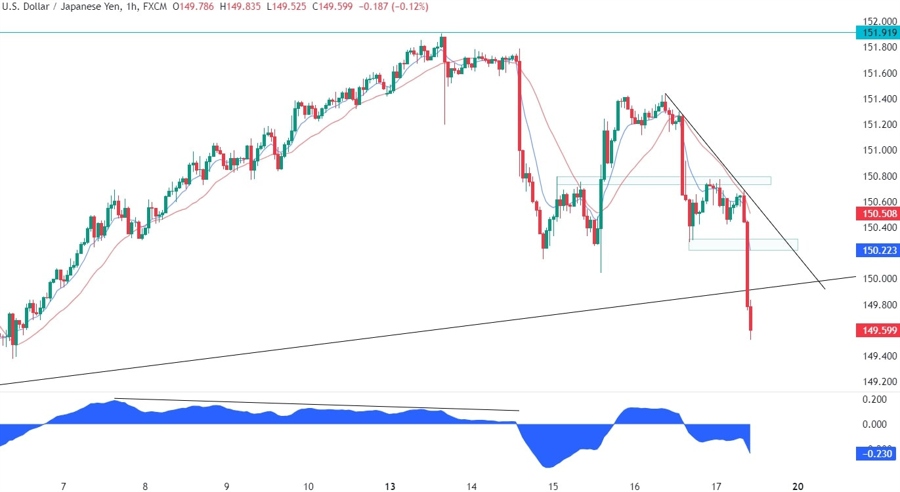
On the 1 hour chart, we can see that the selloff got a bit overstretched as depicted by the distance from the blue 8 moving average. In such instances, we can generally see a pullback into the moving average or some consolidation before the next move.
In this case, if we get a pullback, the sellers are likely to lean on the downward trendline where they will also find the confluence with the red 21 moving average and the previous swing level. The buyers, on the other hand, will want to see the price breaking above the trendline to invalidate the bearish setup and position for a rally into the highs.


