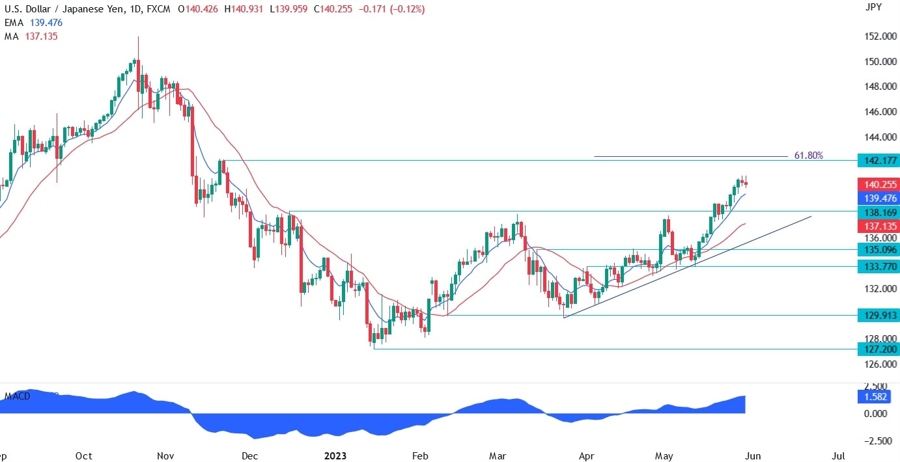
On the daily chart below, we can see that USDJPY has been on a strong rally since the hot NFP report in the beginning of May. The US data since then have been all good and core inflation readings look more and more sticky as also shown by the US PCE report last Friday. The target for the current rally is the 142.17 resistance where we can also find the 61.8% Fibonacci retracement level.
We should see the sellers lean on that resistance with a defined risk just above it with the 138.16 support as the first target. The buyers, on the other hand, will keep pushing as long as the market sees more rate hikes from the Fed.
USDJPY Technical Analysis
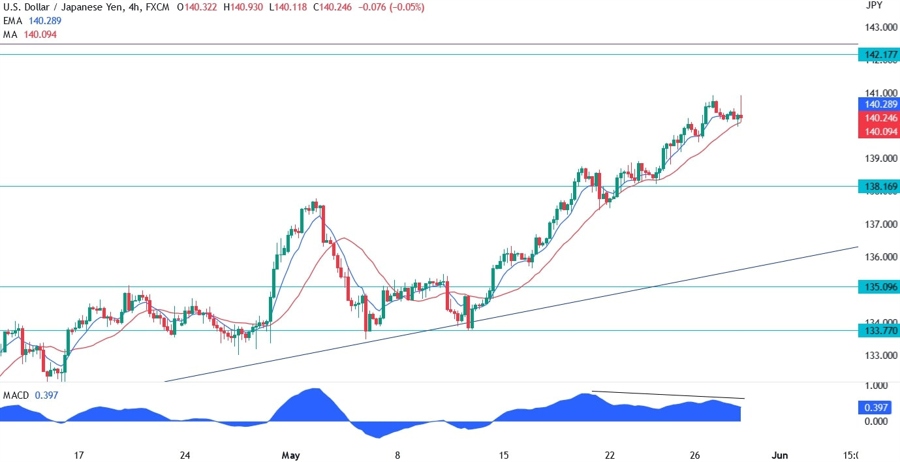
On the 4 hour chart below, we can see that USDJPY is starting to diverge with the MACD into the 142.16 resistance. This is a sign of weakening momentum often followed by pullbacks or reversals. The red 21 period moving average have been acting as a dynamic support for the buyers and it will be significant if we see moving averages crossing to the downside as the sellers will take it as a signal that a bigger pullback may be due.
The things to watch next are the US labour market data this week starting with the US Job Openings tomorrow and ending with the US NFP on Friday.
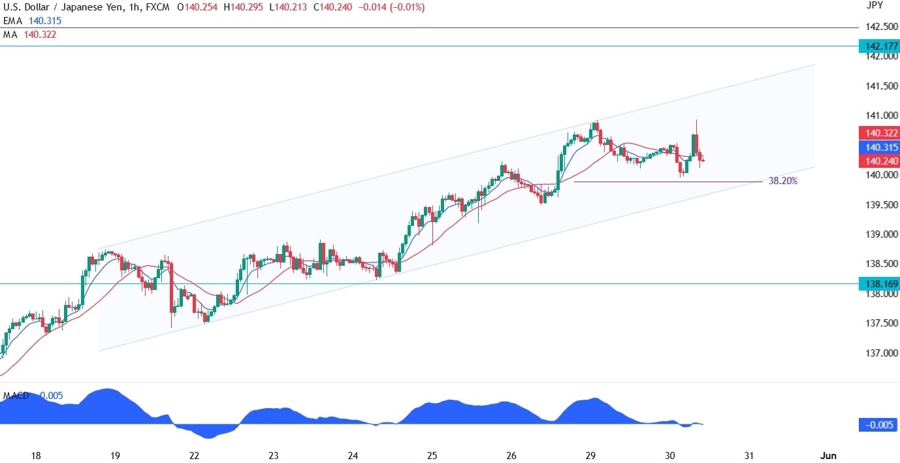
On the 1 hour chart below, we can see that the price is now trading within a rising channel. There’s a support zone at the lower bound of the channel where we can find also the 38.2% Fibonacci retracement level for confluence. If USDJPY gets there, the buyers should defend the level and pile in to target another rally towards the 142.16 resistance.
The sellers, on the other hand, will want to see the price breaking lower before jumping onboard and target the 138.16 support. On the fundamental side, misses in the data should favour the JPY, while beats should support the USD.