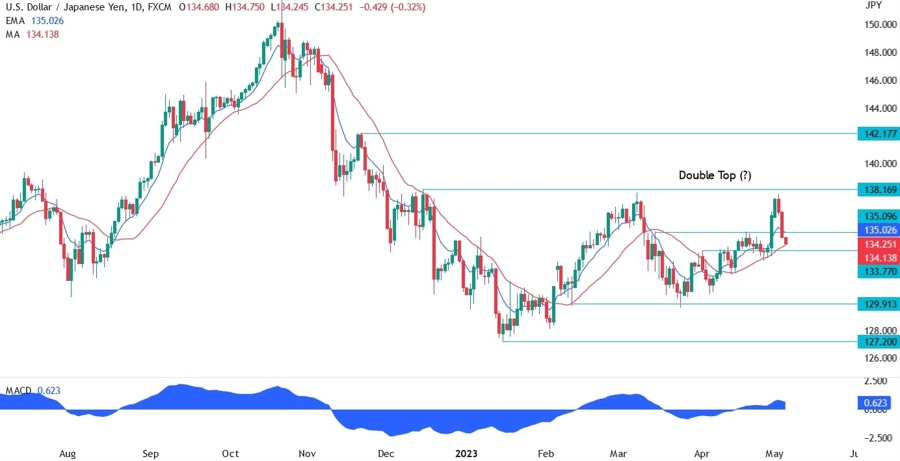
On the daily chart below for the USDJPY , we can see that after the huge rally caused by the once again dovish BoJ, the price found resistance near the last high at 137.90 and then sold off as the US Job Openings missed expectations. The price then bounced a little from the resistance turned support at the 135.09 level, but then broke through as the Fed hinted at a pause if the disinflationary trend continues as expected.
The price is now at the red long period moving average and it’s likely that will see some support here. This big selloff from the 138 handle may also turn into a big double top pattern which would have the 122 handle as the ultimate target.
USDJPY technical analysis
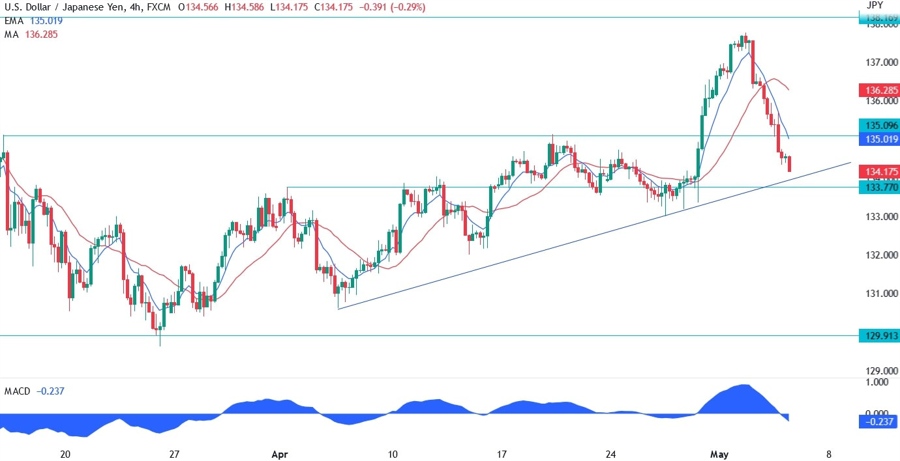
On the 4 hour chart below, we can see that there’s lots of support around the 134 handle with the trendline, the previous resistance turned support and the daily red long period moving average. The price is also a bit overstretched as we can see by the distance from the blue short period moving average. When this happens, we can generally see some consolidation or pullback before the next move.
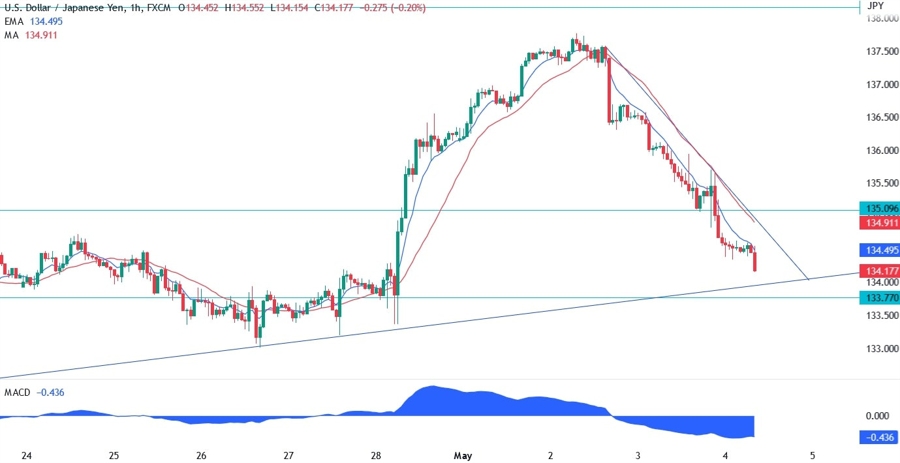
On the 1 hour chart below, we can see that the moving averages are acting as resistance for the price and we also have a downward trendline defining the bearish momentum. The sellers are likely to lean on those in case the price pulls back while the buyers will want to see a break above the trendline supported by a fundamental catalyst before piling in and extending the move to the upside. Today, we have the US Jobless Claims report and it’s likely that we will see a deeper pullback in case of a big beat and a break below the 133.70 support in case of a big miss.