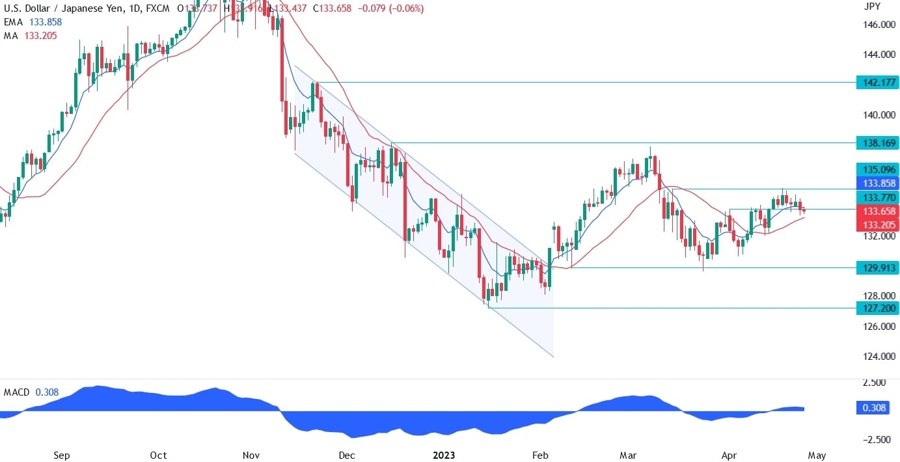
On the daily chart below for USDJPY , we can see that the price rallied towards the 135 handle resistance and got rejected. The sellers leant on that major psychological round number and pushed the price lower as the US data started to deteriorate.
The price has now broken below the 133.70 support and the sellers are eyeing a return to the 130 handle. The red long-period moving average will act as support for the buyers though, so we are likely to see some consolidation before the next fundamental catalyst moves the market.
USDJPY technical analysis
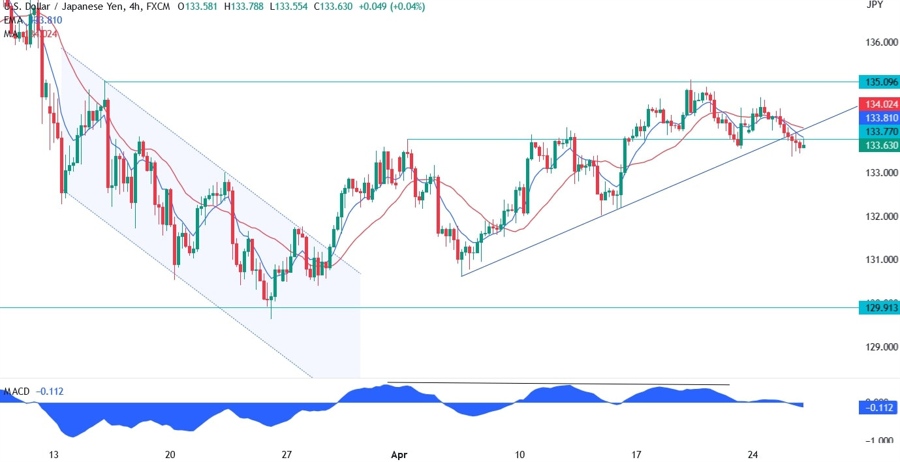
On the 4 hour chart below, we can see that yesterday we got continuing selling as the risk off sentiment sent the JPY higher. The likely culprit should be the issues with the FRC bank which reported a huge drop in deposits the prior day and ignited again fears around the banking sector.
The FRC bank stock fell almost 50% since the earnings report. On the USD/JPY chart we can also notice that the whole move towards the 135 handle was diverging with the MACD, and the price has now even broken below the trendline. This should be a signal that the price has further downside ahead.
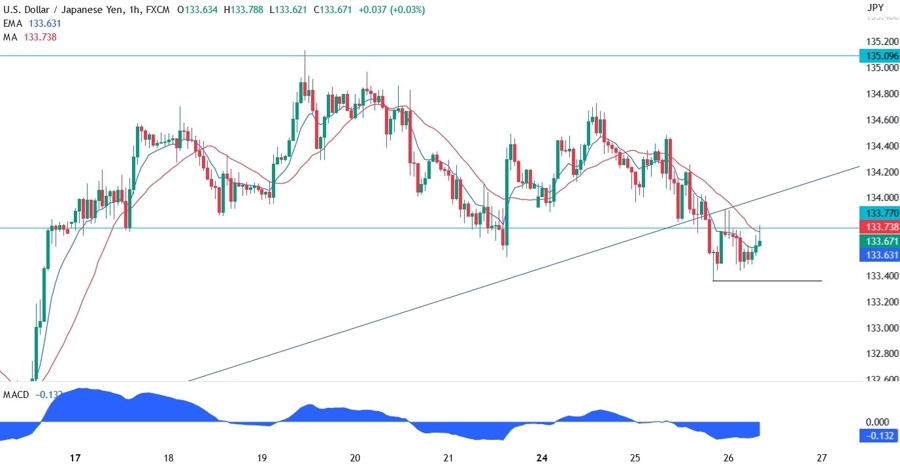
On the 1 hour chart below, we can see that at the moment we have some consolidation just below the 133.77 support and the red long period moving average. The sellers are likely to lean on this support zone to target a break below the swing low, defined by the black line, and then print new lower lows.
The buyers, on the other hand, will want the price to break above the trendline to gain enough conviction to target the 135 resistance again. Tomorrow, the US Jobless Claims should be a market moving event and it’s likely that we will see further downside in case the data misses expectations but a correction higher in case the data beats.