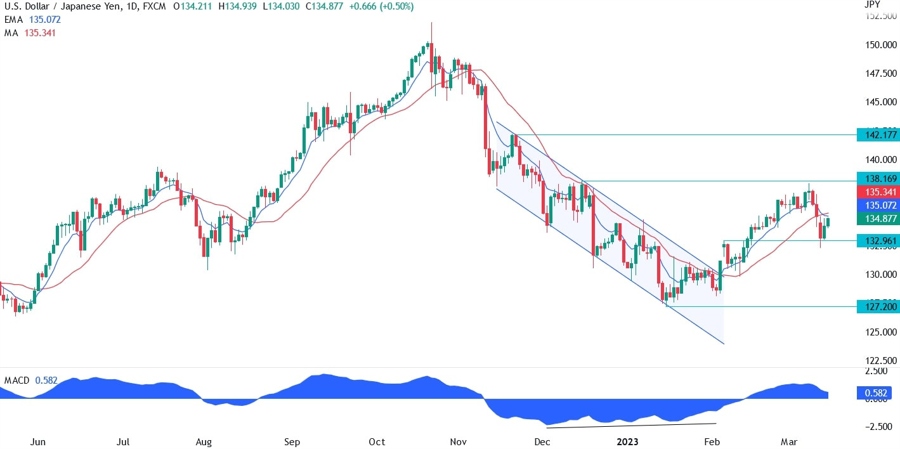
On the daily chart below, we can see that the buyers couldn’t manage to break the 138 handle and the sellers took control as risk aversion spread across the markets. The selloff in the USD/JPY pair began with the higher unemployment rate and lower than expected wage gains in the NFP report.
Soon after, the selloff intensified as the Silicon Valley Bank failed and the markets started to fear a contagion and another banking crisis. Treasury yields started to fall fast and dragged the pair lower. At some point the market was pricing three rate cuts by the end of the year and no hike at the March meeting.
This repricing weighed on the US Dollar and gave the buyers a hard time. The price bounced from the 132.96 support and the moving averages are on the brink of crossing lower, which may be a bad omen for the buyers.
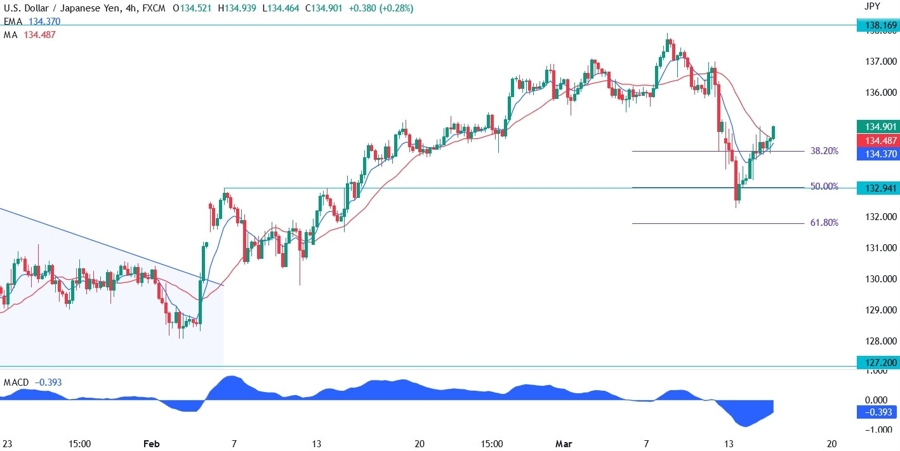
On the 4 hour chart below, we can see that after the Treasury and the Fed took emergency actions on Monday to calm the markets and avert a banking crisis, the pair started to drift higher. The bounce came at the 133 handle and the 50% Fibonacci retracement level of the entire move higher since February.
Moreover, yesterday the US CPI report showed that inflation is still too high in the US, although the data was in line with expectations and didn’t trigger major moves. If the sellers manage to push the price below the 133 level again, then they should be in control and we may see a fall towards the 131 or 130 levels.
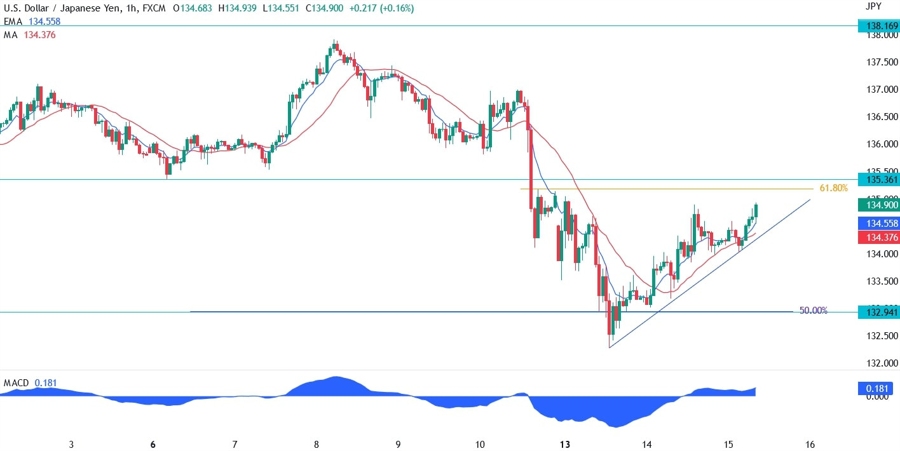
On the 1 hour chart below, we can see that the sellers will lean on the resistance at 135.36 where we have also the confluence with the 61.8% Fibonacci retracement level. More conservative sellers may want to wait for a break below the trendline before taking new short positions.
The buyers, on the other hand, will want to wait for a break above the 135.36 resistance before considering new longs and the trendline will act as support for them.