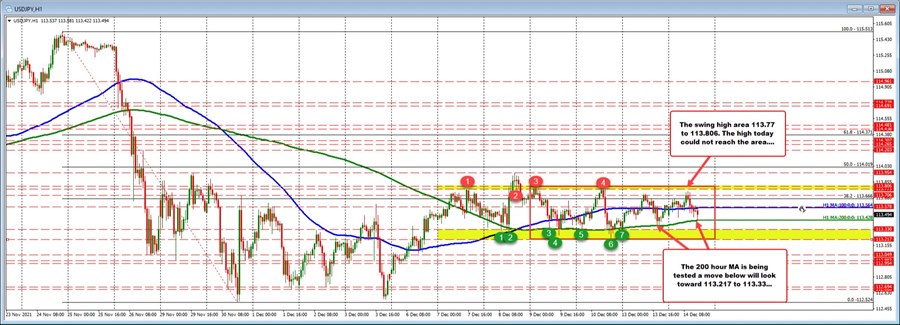
The USDJPY continues to trade in a narrow range between 113.217 and 113.806. That range has defined trading over the last four trading days.
In between sits the 100 hour moving average at 113.564 and the 200 hour moving average at 113.428 (blue and green lines respectively). The low today and lows from yesterday stalled near the lower 200 hour moving average. Getting below that level would increase the bearish bias, but so far dip buyers have used it to lean against and push the price higher.
On the topside, the high price today traded up to 113.75. That was short of a recent high swing area between 113.773 and 113.806. Last Wednesday the price did extend above that swing area to a high of 113.954. Each those areas are upside target on further momentum in that direction.
For now, the pair remains contained and awaits the next shove outside of the narrow trading range. Traders will use the moving averages as interim bias defining levels.
US stock premarket trading are moving further to the downside after the higher-than-expected PPI data. The NASDAQ index is down -162 points. The S&P index is down around -28 points and the Dow industrial average is down -104 points


