The USDJPY has seen some bend (to the downside), but it did not break.
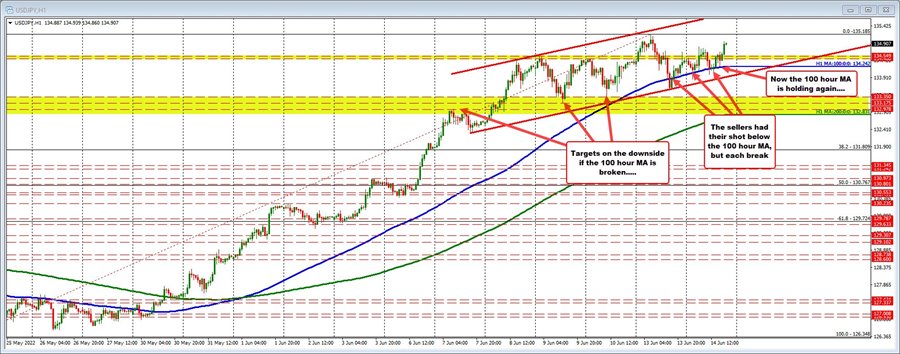
Looking at the hourly chart, the price moved below the 100 hour MA, but failed and moved back higher. Today, the price moved below the 100 hour MA in the Asian session and again in the London morning session (those moves below also failed).
The price action in the New York morning session has been able to hold support against that 100 hour moving average at 134.242 currently (blue line) and move higher. The price just reached a new high of 134.97. The next target comes against the high price from yesterday at 135.1852.
The sellers had the shot yesterday and again today. The price fell below the 100 hour moving average for the first time since May 30 and could not sustain momentum. Could they take and hold control?
After the run higher seen recently in this pair, the sellers need to prove not only that the can break below support levels, but they also need to prove that they can stay below the broken support levels.
Moreover, traders need to reach targets in the countertrend direction IF a level - like the 100 hour MA - is broken.
Downside targets include the low from Friday at 133.35, the low from Thursday at 133.175 the swing high from June 7 near 132.978, and the rising 200 hour moving average at 132.831 (green line in the chart above) are all targets that would need to be broken to give sellers more confidence and more control.
Absent that progression, and there may be trading opportunities in the short-term, but as far as control from anything but the short-term, it still sits with the buyers. They still have the strongest hand and no matter if the high is a 20 year high or 23 year high, it doesn't matter. Sellers have to prove they can take control.
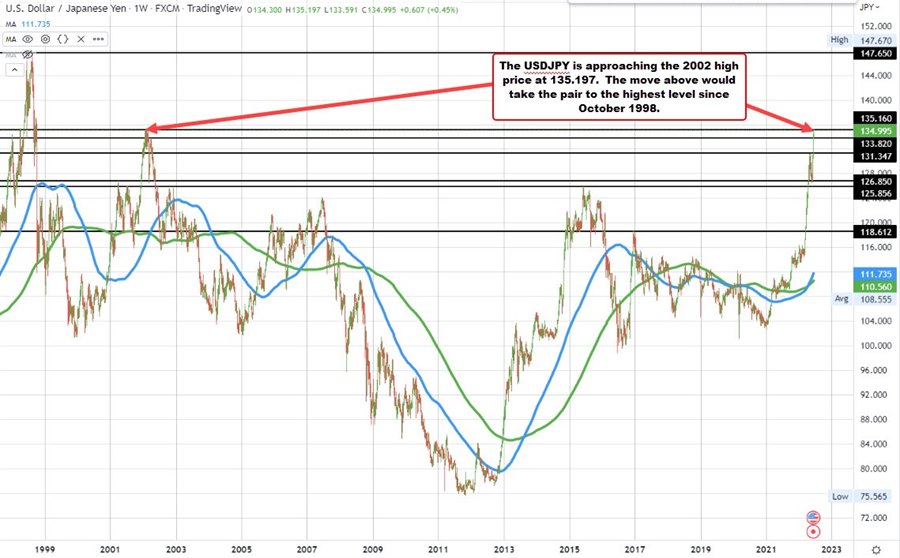
Speaking of 20 year highs, the high price from 2002 reached 135.197. The current prices trading just below the 135.00 level. In the same way there are key targets on the downside, there are also targets on the topside.
The 2002 high at 135.197 is a key upside target for both buyers and sellers. For buyers, they want to see it broken. For sellers looking to pick yet another top, and/or stick a toe in the water where risk can be defined and limited, it needs to stall the rally.
So be aware that there may be sellers against the 20 year high with stops on a break above.
BTW a move above would take the pair to the highest level since October 1998 (or a near 24 year high).