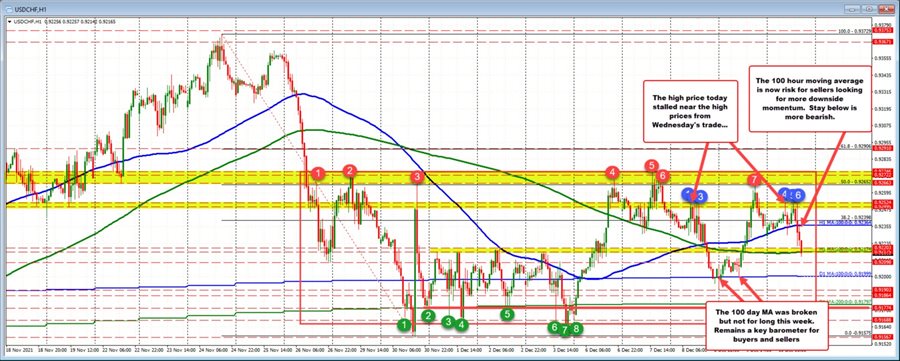
Earlier today, the USDCHF traded mostly above its 100 hour moving average (blue line) and within a narrow trading range ahead of the US CPI report. The highs for the day stalled near highs from Wednesday's trade in the 0.92495 to 0.92524 area (three separate highs - see blue numbered circles in the chart above). The low was just below its 100 hour moving average (blue line)
The subsequent move lower post the CPI has the pair extending the trading range and also moving below its 200 hour moving average at 0.92174. The low price extended to 0.92126 so far.
Sellers are making the next play on the break of the 200 hour moving average. The aforementioned 100 hour moving average at 0.92364 is a risk level now. The best case scenarios for sellers to push the price further to the downside with the 100 day moving average at 0.91999 (call it 0.9200) the next key target.
Recall from Wednesday and early Thursday's trade, the price did dip below the 100 day moving average, but could not sustain downside momentum for long. That moving average remains a key barometer (along with the hourly moving averages) for the buyers and sellers. Taking a broader look going back to November 26, the price has been within a up and down trading range. Most of the price action is between 0.9165 and 0.9274 (about 109 pips - see green and red numbered circles). For this week mostly price action has been higher and above the 100 day moving average.
