USD
- The Fed left interest rates unchanged as expected at the last meeting with a shift in the statement that indicated the end of the tightening cycle.
- The Summary of Economic Projections showed a downward revision to Growth and Core PCE in 2024 while the Unemployment Rate was left unchanged. Moreover, the Dot Plot was revised to show three rate cuts in 2024 compared to just two in the last projection.
- Fed Chair Powell didn't push back against the strong dovish pricing and even said that they are focused on not making the mistake of holding rates high for too long.
- The latest US PCE missed expectations across the board with the Core 6-month annualised rate falling below the Fed’s target at 1.9%.
- The labour market has been softening via less job opportunities rather than more layoffs with the US Job Openings yesterday missing expectations and the inside data painting an even weaker picture.
- The ISM Manufacturing PMI yesterday beat expectations although it continues to remain in contraction.
- The market expects the Fed to start cutting rates in Q1 2024.
CHF
- The SNB kept interest rates unchanged at 1.75% at the last meeting stating that they will adjust policy if necessary to ensure that inflation remains in the target range.
- The SNB Governor Jordan said that the monetary conditions are appropriate and that they do not forecast any further tightening.
- The recent Switzerland CPI missed expectations by a big margin with the inflation rate remaining in the SNB’s target band.
- The Unemployment Rate remains steady at cycle lows.
- The Manufacturing PMI recently rose slightly although it remains in contraction, while the Services PMI hold on in expansion.
- The market expects the SNB to start cutting rates in Q2 2024.
USDCHF Technical Analysis – Daily Timeframe
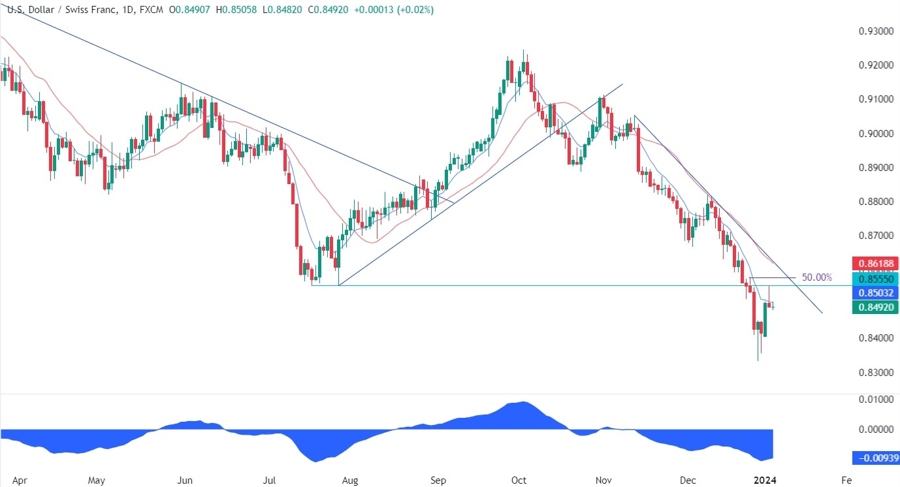
On the daily chart, we can see that USDCHF recently bounced around the 0.83 handle following an aggressive selloff last week. The pair pulled back into the previous low around the 0.8555 level where we have a strong resistance zone. In fact, we can see that we have the confluence with the trendline, the 50% Fibonacci retracement level and the red 21 moving average. This is where the sellers should step in to position for a drop into new lows while the sellers will want to see the price breaking higher to invalidate the bearish setup and start targeting the 0.88 handle.
USDCHF Technical Analysis – 4-hour Timeframe
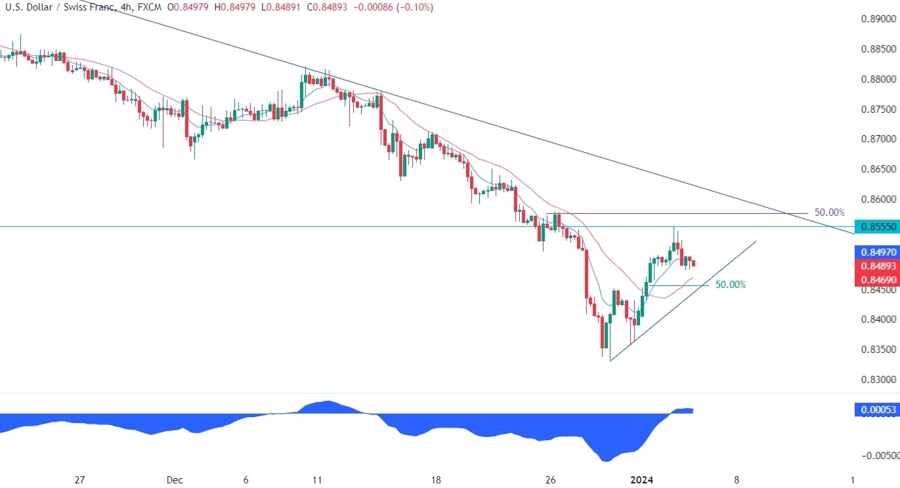
On the 4-hour chart, we can see that on this timeframe we now have an uptrend as the price has been printing higher highs and higher lows with the moving averages being crossed to the upside. The buyers are likely to lean on the upward trendline where they will find the confluence with the 50% Fibonacci retracement level and the red 21 moving average. The sellers, on the other hand, will want to see the price breaking below the trendline to increase the bearish bets into new lows.
USDCHF Technical Analysis – 1-hour Timeframe
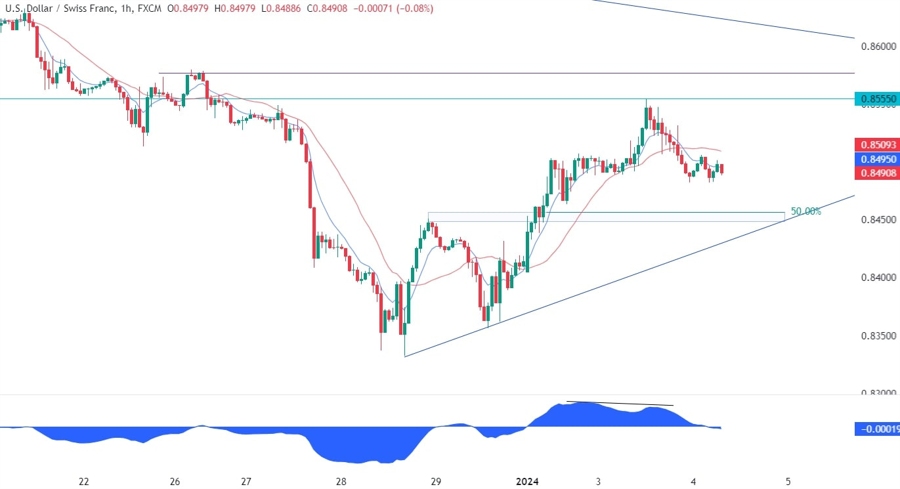
On the 1-hour chart, we can see more closely the current price action and we can notice that the latest leg higher into the 0.8555 resistance zone diverged with the MACD. This is generally a sign of weakening momentum often followed by pullbacks or reversals. In this case, the target for the pullback should be around the 0.8450 support zone, which is also where the buyers are likely to pile in to position for a rally into the major trendline.
Upcoming Events
Today we will have another slate of US labour market data with the release of the US ADP and Jobless Claims figures. Tomorrow, we conclude the week with the NFP report and the ISM Services PMI.


