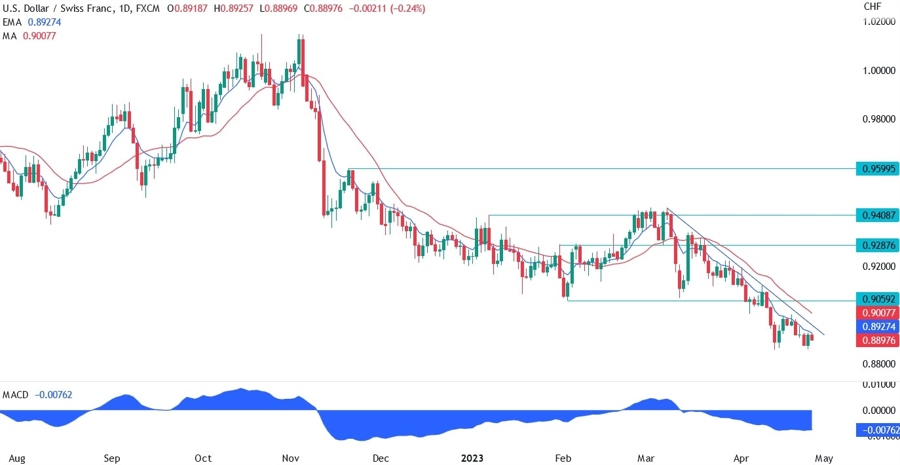
On the daily chart below for USDCHF, we can see that the price keeps trending downwards as the market sees the end of the Fed’s tightening cycle at the next meeting, inflation falling back to target and a recession on the horizon.
The major trendline and the moving averages keep defining this downtrend and the sellers keep entering the market with conviction at every pullback. As long as the US data keeps deteriorating, we are likely to see new lower lows in the pair going forward.
USDCHF technical analysis
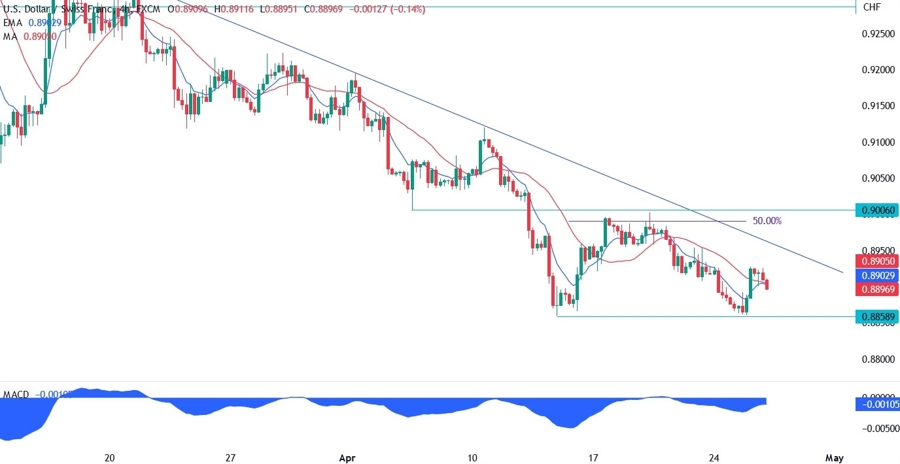
On the 4 hour chart below, we can see that the last pullback rejected the 50% Fibonacci retracement level and the resistance at the 0.90 handle before falling back down to the 0.8858 low. At the moment the price is bouncing again from the low with the buyers likely targeting the trendline. The sellers will lean on that trendline again if the price gets there.
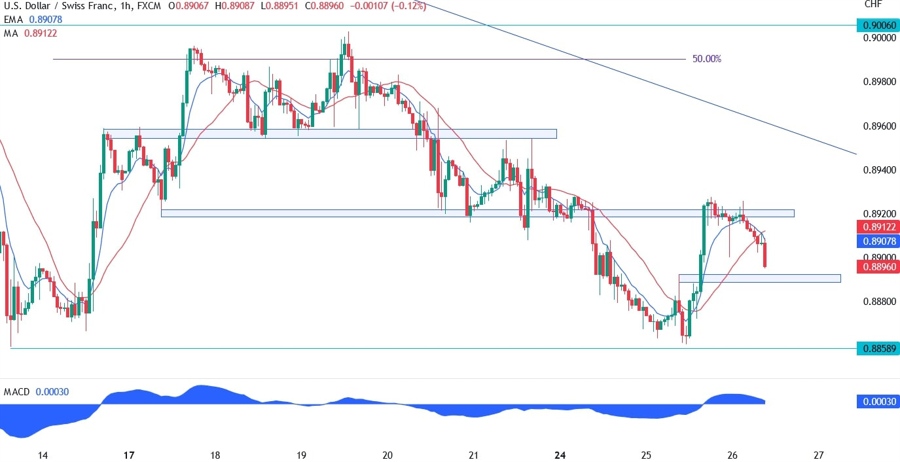
On the 1 hour chart below, we can see that the price has been trading cleanly between swing levels. The buyers will need to break above the support turned resistance at 0.8920 to ultimately push the price towards the trendline.
The sellers, on the other hand, will keep on leaning against the 0.8920 resistance to target a break below the 0.8890 support and push the price to the 0.8858 low and beyond. The US Jobless Claims tomorrow will be a market moving event and a miss is likely to cause another depreciation in the pair while a beat should extend the correction higher.