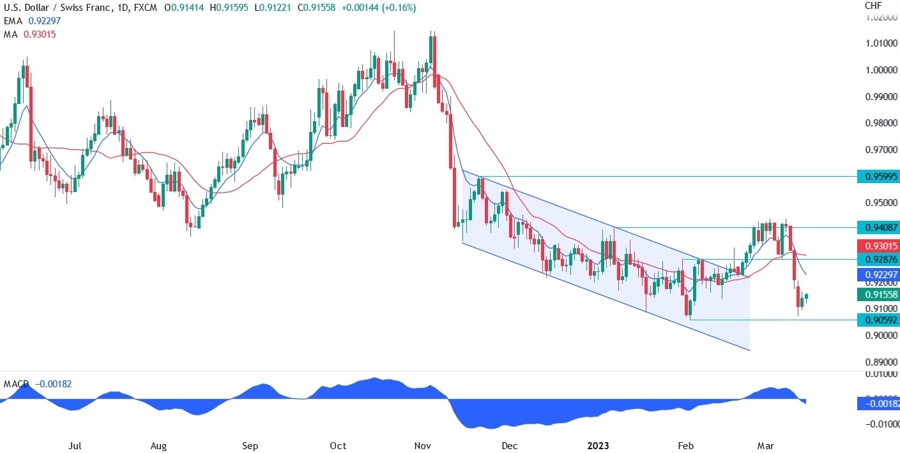
On the daily chart below, we can see the big selloff starting from the resistance at 0.94. We got three waves of selling in the pair. The first was caused by higher-than-expected jobless claims on Thursday. The second started on Friday as the unemployment rate increased and wage gains were less than expected.
The same day the Silicon Valley Bank failed and caused a risk off across the board with markets fearing another banking crisis. The last one on Monday was the peak in fear when treasury yields fell a lot in a single day as the market was pricing at some point three rate cuts by the end of the year an no hike at the March FOMC meeting.
As things calmed a bit, the buyers stepped in again pushing the price up. We can see that the market is overstretched as depicted by the distance of the price from the blue short period moving average. We should therefore see a pullback towards the moving average.
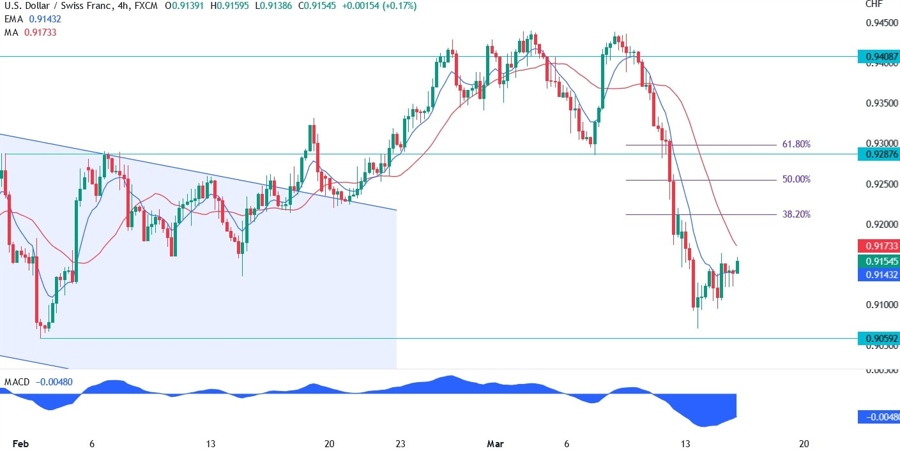
On the 4 hour chart below, we can see the Fibonacci retracement levels of the entire move lower since last week. The most important levels for the sellers will be the 38.2% which is where the price should touch the daily short period moving average and the 61.8% where we have also the previous strong support that now may turn into resistance.
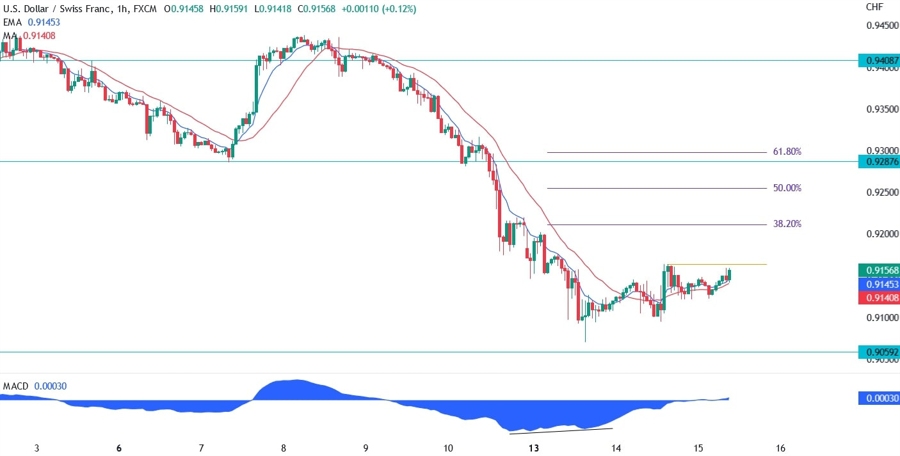
On the 1 hour chart below, we can see that in the near term, the buyers may want to target the 38.2% as soon as they break the orange resistance at 0.9164. The divergence between the price and the MACD of the last move lower towards the 0.9059 support signalled a weakening selling momentum, and often times the price pulls back to the top of the divergent move, which would coincide with the 38.2% Fibonacci level.