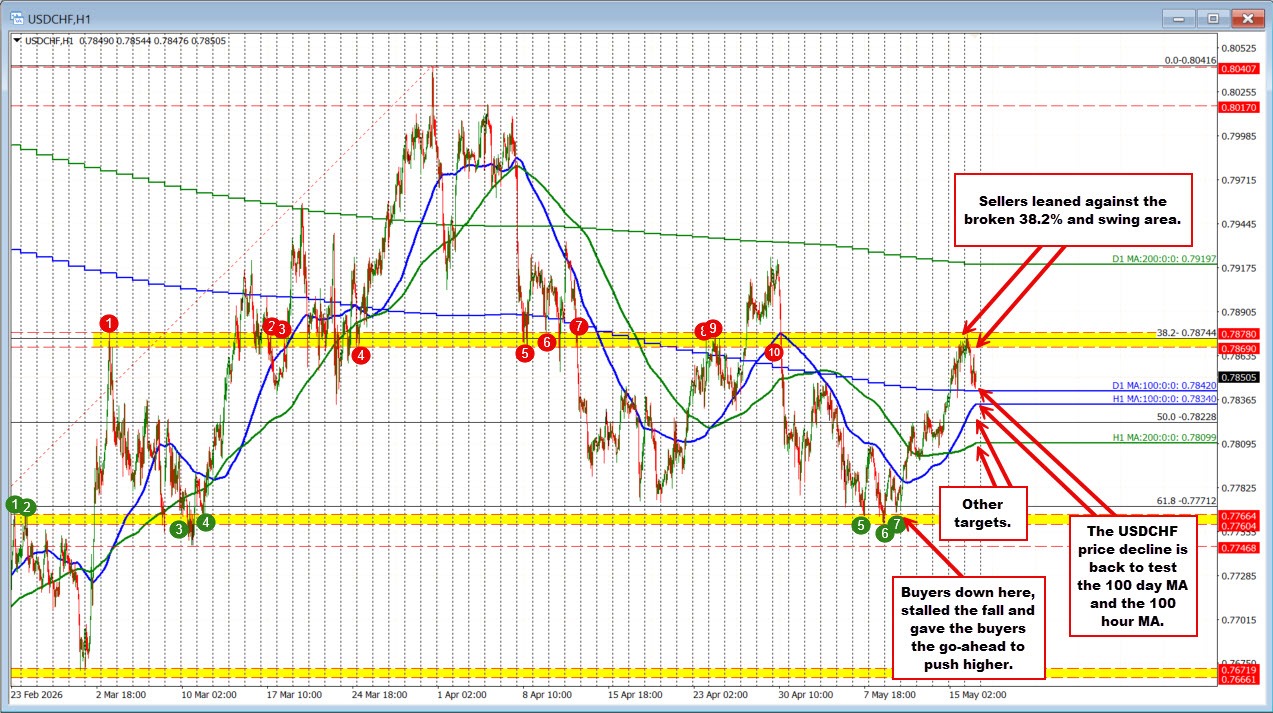
The USDCHF has once again run into a familiar technical ceiling, and sellers are leaning against the resistance area.
Looking at the hourly chart, the pair pushed higher on Friday and into trading today, reaching a key resistance zone between 0.7869 and 0.7880. That area is not random. It is defined by the broken 38.2% retracement of the move up from the January low and also corresponds with a swing area that repeatedly attracted both buyers and sellers during March and April trading.
As the price moved into that resistance target earlier today, upside momentum stalled and the pair rotated lower. The inability to extend above the broken resistance zone gave sellers the go-ahead to push the USDCHF back down toward an important cluster of moving averages that now define the near-term technical battle.
The key support area comes in between:
- 100-day moving average near 0.7842
- 100-hour moving average near 0.7834
That zone is acting as a critical risk-defining area for traders. If buyers can hold support against those moving averages, the pair could regroup and make another run back toward the 0.7869–0.7880 resistance zone. However, a break below the moving-average cluster — and more importantly, staying below it — would tilt the bias back to the downside and open the door for further selling pressure.
On the downside, traders will be watching the following technical targets:
- 0.7823 — the 50% midpoint of the move up from the January low
- 0.7809 — the 200-hour moving average
- 0.7760–0.7766 — a key swing area and the 61.8% retracement of the move up from the January low
That lower yellow support zone proved to be an important turning point earlier in May, where buyers leaned against support and launched the latest corrective rally higher.
For now, the market remains trapped between well-defined resistance above near 0.7878 and a major moving-average support cluster below. The next break should go a long way in determining the next directional move for the USDCHF.


